Download

1 / 21
210 likes | 214 Views
Renal Association UK Renal Registry. Blood pressure and mortality risk in peritoneal dialysis patients in England and Wales. Udaya P.Udayaraj , R.Steenkamp, F.Caskey, D.Ansell, C.Tomson UK Renal Registry, Bristol, UK www.renalreg.org. Renal Association UK Renal Registry.

E N D
Renal Association UK Renal Registry Blood pressure and mortality risk in peritoneal dialysis patients in England and Wales Udaya P.Udayaraj, R.Steenkamp, F.Caskey,D.Ansell, C.Tomson UK Renal Registry, Bristol, UK www.renalreg.org
Renal Association UK Renal Registry Introduction • General population – linear or ‘J’ shaped association of BP with mortality Lewington et al. Lancet, 2002; 360:1903-13
Renal Association UK Renal Registry Introduction • ‘Reverse J’ or ‘U’ association well described in hemodialysis (HD) patients Zager et al. KI,1998;54:561-69 Kalantar-Zadeh. Hypertension, 2005;45:811-17
Renal Association UK Renal Registry Introduction • Is this ‘reverse’ association related to HD procedure? • Creation of AV fistula can predispose to myocardial ischemia‡ • Hypotension during HD can precipitate myocardial ischemia * and is associated with increased mortality † • ‡ Savage et al. AJKD 2002; 40: 753-59 • * Selby et al. Semin Dial 2007; 20:220-28 • † Shoji et al. KI 2004; 66:1212-20
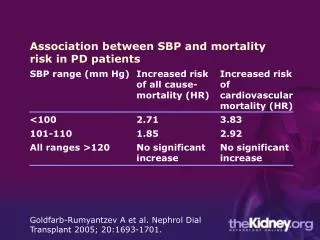
Renal Association UK Renal Registry Introduction • Previous studies in peritoneal dialysis (PD) patients – inconsistent results due to small sample size †or short follow up ‡ • Low BP associated with lower mortality in kidney transplant recipients • Association of BP and survival amongst dialysis patients awaiting transplantation is not known • † Lynn et al. KI 2002;62:2281-2287 • Ates et al. Kidney Int 60: 767-776, 2001 • Jager et al. Kidney Int 55: 1476-1485, 1999 • ‡ Rumyantazev et al. NDT 2005;20:1693-1701 • Rocco et al. Perit Dial Int 22: 371-379, 2002
Renal Association UK Renal Registry Aim To study the association of BP and mortality in • a larger cohort of peritoneal dialysis patients • a subgroup of patients who are registered on the kidney transplant waiting list
Renal Association UK Renal Registry Methods (Databases) • UK Renal Registry (UKRR) • Established in 1997 • 100 % coverage of England and Wales expected by 2007 • Fully electronic data extraction from clinical information system • Quarterly biochemical and clinical data on all patients on renal replacement therapy (RRT) • UK Transplant (UKT) • Maintains national organ donor register • Holds data on kidney transplant waiting list
Renal Association UK Renal Registry Study population Incident RRT patients 1997-2004 in England and Wales • Inclusion criteria • From centres with >85% ethnicity data completeness † • Age >18 years • On Peritoneal dialysis at day 90 • Exclusion criteria • Missing data on age/gender/ cause of renal failure/ethnicity • Transplant prior to day 90 • Missing BP data in 1st or 2nd quarter † No difference in survival or baseline characteristics of patients in centres with > 85 % and < 85% data
Renal Association UK Renal Registry Statistical analysis • BP measurements • Mean BP value in the 1st/2nd quarter of RRT • Systolic, Diastolic, Mean arterial and pulse pressure studied • Cox regression model • BP as a continuous variable ( linear and non linear terms) • Factors adjusted in multivariate model • Age, gender, ethnicity, cause of renal failure, haemoglobin, corrected calcium, phosphate, serum albumin • Change of RRT modality as time dependent variable ( i.e. patients not censored at modality change) • Time to inclusion on Transplant waiting list as surrogate for co-morbidity
Renal Association UK Renal Registry • Outcome • All cause mortality after day 90 • All patients followed until 31.12.05 or death • Subgroup analyses • Diabetics and non diabetics • Transplant waiting list registration status in 1st year of RRT ( all cause mortality from 1 year after start of RRT) • Waitlisted within 1st year from start of RRT • Not waitlisted within the 1st year from start of RRT
Renal Association UK Renal Registry Results(Study cohort) Cohort selection no. of patients included PD at day 90 ( centres >85 % ethnicity data) 3,991 With data on ethnicity, cause of renal failure,3,822 previous transplant With SBP/DBP data* 2,061 With data on lab parameters and date of 2,035 Transplant waitlisting * No difference in baseline characteristics and survival between those included and excluded except % males was more in excluded cohort (62.8% vs 58.2%)
Renal Association UK Renal Registry Baseline Characteristics
Renal Association UK Renal Registry Cox regression models P< 0.0002 P= 0.01 † †Adjusted for age, gender, cause of renal failure, ethnicity, lab parameters, treatment modality, time to transplant waiting list
Renal Association UK Renal Registry Cox Regression models † P= 0.0007 P=0.05 †Adjusted for age, gender, cause of renal failure, ethnicity, lab parameters, treatment modality, time to transplant waiting list
Renal Association UK Renal Registry Subgroup analyses – Time to transplant waiting list (WL) P =0.07 p =0.01 P= ns P = ns WL < 1 year (n=675) HR per 10 mmHg 1.14, 95 % CI 0.99-1.31 HR per 10 mmHg 1.29, 95 % CI 1.05-1.59 p =0.01 HR per 10 mmHg 1.33, 95 % CI 1.07-1.67 P = ns † Survival after 1 year, Adjusted for age, gender, cause of renal failure, ethnicity, lab parameters, treatment modality
Renal Association UK Renal Registry Subgroup analyses - Diabetes • Diabetic – no association of any BP component with mortality • Non diabetic – U shaped for SBP and reverse J for MAP (as for entire study cohort) † Adjusted for age, gender, ethnicity, lab parameters,treatment modality, time to transplant waiting list
Renal Association UK Renal Registry Summary Pattern of association of BP and mortality was • For the entire study population • U shaped for SBP • Reverse J for MAP • No association for DBP and PP • For those registered on the transplant waiting list within first year • Linear for SBP, DBP, MAP • No association for PP • For patients with diabetes • No association with any BP components
Renal Association UK Renal Registry • Strengths • Largest study to date on PD patients • First to describe the association of BP and survival in patients on the transplant waiting list • Novel analytic strategy of adjusting for modality change allowed extended follow up of patients without censoring • Limitations • BP measurement not standardised • Lack of data on co-morbidity, residual renal function dialysis dose • No data on cardiac function or anti HT medications
Renal Association UK Renal Registry Conclusions • High and low SBP are risk factors for increased mortality in incident PD patients • Low SBP was not associated with increased mortality in a subgroup of patients activated early on the transplant waiting list • Association of low SBP and mortality seen in entire study cohort could reflect poor cardiac function/ health status • The BP associated with best survival may vary for different patient subgroups