Download
1 / 14
140 likes | 285 Views
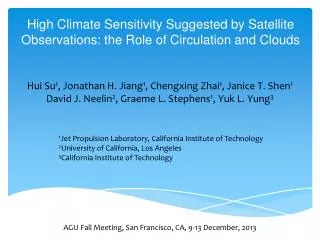
High Climate Sensitivity Suggested by Satellite Observations: the Role of Circulation and Clouds. Hui Su 1 , Jonathan H. Jiang 1 , Chengxing Zhai 1 , Janice T. Shen 1 David J. Neelin 2 , Graeme L. Stephens 1 , Yuk L. Yung 3. 1 Jet Propulsion Laboratory, California Institute of Technology

E N D
High Climate Sensitivity Suggested by Satellite Observations: the Role of Circulation and Clouds Hui Su1, Jonathan H. Jiang1, Chengxing Zhai1, Janice T. Shen1 David J. Neelin2, Graeme L. Stephens1, Yuk L. Yung3 1Jet Propulsion Laboratory, California Institute of Technology 2University of California, Los Angeles 3California Institute of Technology AGU Fall Meeting, San Francisco, CA, 9-13 December, 2013
Motivation ? Cloud Feedback Climate Sensitivity • Model differences in cloud feedback is a leading contributor to the uncertainty of climate sensitivity. • What process drives the inter-model spread in cloud feedbacks? • Satellite observations have been used extensively to evaluate model performance of present-day climate. • Can satellite observations provide indications of future climate change?
Cloud Feedback and Climate Sensitivity CLIMATE SENSITIVITY Cess et al. (1989) Stephens (2005) “one step toward unraveling the complex nature of cloud feedback lies ultimately in understanding the influence of the large scaleatmospheric circulation on clouds.” - Stephens (2005) A “Three Cs” Investigation
Changes of the Hadley Circulation, Clouds and Cloud Radiative Effects in the RCP4.5 Multi-model-mean from 15 CMIP5 coupled models ∆ = 2074-2098 in “RCP4.5” – 1980-2004in “historical run”
The Equatorial Tropics (around 5°S to 5°N) S S W W W W S ∆ = 2074-2098 in “RCP4.5” – 1980-2004in “historical run”
The Flanks of Deep Tropics (around 5° to 15°N/S) S S W W W W S ∆ = 2074-2098 in “RCP4.5” – 1980-2004in “historical run”
Equator-ward side of Descent Zone (about 15°-30°N/S) S S W W W W S ∆ = 2074-2098 in “RCP4.5” – 1980-2004in “historical run”
Poleward-side of Descent Zone (about 30°-45°N/S) S S W W W W S ∆ = 2074-2098 in “RCP4.5” – 1980-2004in “historical run”
Quantifying the Model Differences in Circulation and Relation with Cloud Radiative Effect Changes The explained variance by the 1st EOF is 57% • The amplitudes of the 1st EOF mode differ by two orders of magnitude.
DirectCirculation Response and TasMediated Change From 4xCO2 −1xCO2 fixed SST experiments (Bony et al., 2013) • The total circulation change in the RCP4.5 scenario is highly correlated with the circulation response to direct CO2 forcing, at a greater extent than its correlation with global-mean surface temperature change. • Direct circulation response explains 76% of the variance of the total circulation change, compared to 37% by surface warming
Circulation Response, Cloud Feedback and Climate Sensitivity • Fast circulation response to direct CO2 forcing and the total circulation change are both correlated with cloud feedbacks CO2 Forcing Circulation Response Cloud Feedback Climate Sensitivity “ Three Cs”
Comparing to Observations WARMEST 8 models: ECS > 3.4 K COOLEST 7 models: ECS < 3.4 K OBSERVATIONS Zonal mean ω: the Hadley Circulation CloudSat/CALIPSO Cloud Fraction and AIRS/MLS Relative Humidity
New Model Performance Metricsto Represent the Hadley Circulation Structure OBS OBS The best estimates of ECS range from 3.6 to 4.7°C, with a mean of 4.1°C and a standard deviation of 0.3°C, compared to the multi-model-mean of 3.4°C and a standard deviation of 0.9°C.
Conclusions • Changes of the Hadley Circulation exhibit latitudinallyalternating weakening and strengthening structures, with nearly equal contributions by the weakening or strengthening segments to the integrated cloud radiative effect changes within the Hadley Cell. • Model differences in the circulation change at the end of 21st century in the RCP4.5 scenario is highly correlated with fast circulation response to direct CO2 forcing and less correlated with surface warming. • Circulation response is strongly correlated with cloud feedback and model difference in circulation change explains about 50% of the inter-model spread in cloud feedback. • High sensitivity models simulate better the spatial variations of clouds and relative humidity in association with the Hadley Circulation than the low sensitivity models, consistent with earlier studies (Fasullo and Trenberth, 2012; Klein et al., 2013). Suet al, Weakening and Strengthening Structures in the Hadley Circulation Change under Global Warming and Implications for Cloud Response and Climate Sensitivity, J. Geophys. Res., in review, 2013.