Download
1 / 19
200 likes | 403 Views
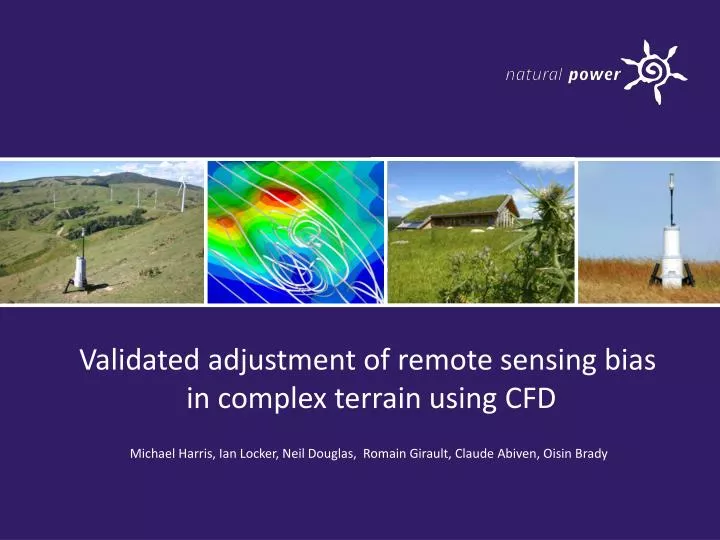
Validated adjustment of remote sensing bias in complex terrain using CFD. Michael Harris, Ian Locker, Neil Douglas, Romain Girault , Claude Abiven, Oisin Brady. What is complex terrain?. Terrain likely to perturb the flow from uniformity at turbine level

E N D
Validated adjustment of remote sensing bias in complex terrain using CFD Michael Harris, Ian Locker, Neil Douglas, Romain Girault, Claude Abiven, Oisin Brady
What is complex terrain? Terrain likely to perturb the flow from uniformity at turbine level Steep slopes can perturb the flow. They can be associated with: - high inflow angle - high veer - recirculation zones - high wind shear - high turbulence
What is complex terrain? Forested areas can perturb the flow. They can be associated with: - high wind shear - high turbulence - amplified risks of recirculation when combined with slopes
WIND Principles of laser anemometry 1. Laser radiation scatters from atmospheric aerosols Laser beam 2. Aerosols move in the same direction and at same speed as the wind Natural Aerosols 3. Line-of-sight wind component induces Doppler shift Lidar 4. Detection of Doppler shifted light
Conically-scanned lidar wind profiler • Assumes uniform flow across disc at each height • Obtains line-of-sight wind component as a function of azimuth angle • Least-squares 3-parameter fit to sine wave • Horizontal wind speed and direction, vertical wind speed, turbulence • Builds up wind profile in 20 seconds by measuring wind speed at chosen heights • Positioning close to mast is no problem
Complex terrain & inhomogeneous flow • Non-uniform flow will lead to uncertainty for both lidarand mast measurement • Full wind vector requires 3 lidars (expensive), or there are more pragmatic solutions • Volume sampling and easy movement of lidar may be advantageous • 50 points per revolution samples non-uniform flow around disk Evolving, non-uniform flow Uniform flow
Hill top measurement: example of flow distortion Flow inclination reduces line-of-sight component in both upwind and downwind directions Lidar under-reads compared to mast Bias is similar for any value of cone angle
Multiple lidar solution: Windscanner (Risø DTU) • Three ground-based lidar systems • Coordinated scanners direct beams to single point in space • Derive 3D wind vector • Investigate detailed flow by scanning intersection point – needs rapid data rates ZephIR 2 ZephIR 1 ZephIR 3
A pragmatic, single lidar approach: adjustment of bias using Ventos CFD modelling • Follows method of Bingøl et al (this used linear model LINCOM/WAsP Engineering) • Use CFD to model the flow over the terrain for 36 (10-degree) sectors • Use results to calculate mean Doppler shifts observed by lidar around its measurement disk • Perform least squares fit to obtain the predicted lidar wind speed for that sector • Hence calculate ratio of lidar/mast wind speed () – this provides a sector-wise adjustment factor for lidar data at this location • Compare predicted adjustment with actual values of from lidar/mast measurements
Modelling – CFD vs Linear Two approaches are used to model the flow at the scale of a wind farm: - linear models and CFD models (Navier-Stokes equations solvers) Linear models (e.g. LINCOM , used in WAsP) solve simplified equations, with the following implications: - break down in case of steepslopes - do not accurately model forests Advantages of CFD models: - better treatment of turbulence, and inflowangle - detection of recirculationzones - time-dependent computations
Case study 1: lidar beside mast on top of a rounded hill • IEC compliant mast (M1) with cups at 43m and 60m • ZephIRlidar (Z1) positioned 8m to south • 3 months concurrent wind data • All sectors represented in wind rose • RIX values indicate high ruggedness to W and E M1 Z1
Sector-wise comparison of predicted and measured differences between lidar and mast General under-read, particularly in E and W sectors Mast shadowing of cup Wind speed ratio (lidar/mast) Wind direction (degrees)
Lidarvs mast correlation plots – before and after adjustment • Unadjusted ZephIR measurements vs mast data • 10-minute average horizontal wind speed • 3% lidar under-read • ZephIR measurements adjusted with Ventos
Variation of wind speed in close vicinity of lidar and mast • Ventos CFD modelling for 270-degree wind bearing, 60m agl • Black circle is ZephIR scan disk • Positions A and B are 50m to E and W of mast • Mean wind at A is ~2.6% higher than at B
Other case studies • Different terrain types examined: forest with clearings, etc. • Dependence on height above ground level investigated • Spatial variation of wind speed for different wind directions
1km Case study 1 • Close to rounded summit • On edge of low tree line with clearings
1km Case study 2 • On side of hill in clearing • Tree heights above 15m
Conclusions • Analysis demonstrates high level of agreement between prediction from Ventos CFD and measured impact of flow distortion on lidar wind speed • Required adjustment to lidar data (2%-5%) is similar magnitude to changes when mast is moved fairly small distance (~100m) • CFD gives closer agreement than linear model, particularly for sectors with high RIX value • Proposed methodology combining lidar and CFD in complex terrain • Adjust lidar data for impact of non-uniform flow • Investigate variations across site to reduce uncertainties of overall assessment
Thank you for your attention Mike Harris michaelh@naturalpower.com Natural Power www.naturalpower.com