Download
1 / 22
220 likes | 237 Views
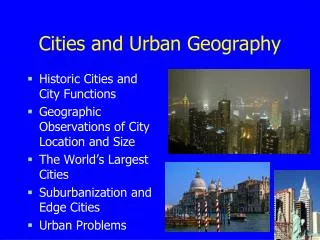
Legible Cities: Focus-Dependent Multi-Resolution Visualization of Urban Relationships. Remco Chang Department of Computer Science UNC Charlotte. Robert Kosara Department of Computer Science UNC Charlotte. Eric Sauda College of Architecture UNC Charlotte. Bill Ribarsky

E N D
Legible Cities: Focus-Dependent Multi-Resolution Visualization of Urban Relationships Remco Chang Department of Computer Science UNC Charlotte Robert Kosara Department of Computer Science UNC Charlotte Eric Sauda College of Architecture UNC Charlotte Bill Ribarsky Department of Computer Science UNC Charlotte Ginette Wessel College of Architecture UNC Charlotte
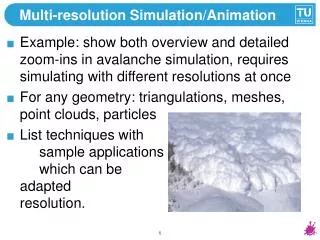
Legible Cities:Motivation • While working on a graphics problem to render large urban environments[1], we realized… • Visualizing a city should be more than rendering its geometric components • There is a lot of information directly tied to geographic locations • Question: how do people think about a city? [1] Remco Chang, Thomas Butkiewicz, Caroline Ziemkiewicz, Zachary Wartell, Nancy Pollard, William Ribarsky. Hierarchical Simplification of City Models to Maintain Urban Legibility. ACM SIGGRAPH 2006 Technical Sketch
Legible Cities:Survey How do you perceive the city? • Describe New York City… • Response 1: “New York is large, compact, and crowded.” • Response 2: “The area where I lived had a strong mix of ethnicities.” Geometric, Information, View Dependent (Cognitive)
Legible Cities:Demo • System Demo
Legible Cities: Research Collaboration Architecture • Theories of City Design and Spatial Structure • City Conveys Meaning through Visual Qualities • Individual’s Experience of a City Urban Visualization • 3D Models of the City • Information Display Embedded in the City • User Interaction for Choosing Point of View (Geometric) (Information) (View Dependence)
Legible Cities: Geometric – Theory of Urban Legibility • Mental Sketch Maps of Cities • Finding commonalities • Elements of Urban Legibility • Urban Theorist Kevin Lynch UNC Charlotte Campus Boston, MA Boston, MA
Legible Cities: Geometric Modeling • Definable Elements in the City • “Imageability” Identity, Recognition, Meaning • Spatial Understanding of the City using Lynch’s Rules of Urban Legibility Path District Node Edge Landmark Kevin Lynch. The Image of the City. Cambridge: MIT Press, 1960.
Legible Cities:Information Modeling – Iconology • Robert Venturi and Denise Scott Brown • Iconology • Signs, Symbolism, Information • Information Overlay R. Venturi, D. S. Brown, and S. Izenour. Learning form Las Vegas.Cambridge: The MIT Press, 1977.
Legible Cities:View Dependence - Experiential • Gordon Cullen • Understanding of Architecture is based on optics, place, and content • Experience of Movement, Uncovering, and Texture G. Cullen. The Concise Townscape. Oxford: The Architectural Press, 1961.
Legible Cities:Interpretation of Urban Theories • Geometric • Hierarchical building clustering using the theory of Urban Legibility • Information • Matrix view shows information about building clusters • Parallel coordinates show relationships between dimensions • View Dependence (Cognitive) • 2D translation of yellow sphere changes the position of focus • Z-axis zooming changes the degree of focus
Legible Cities:Coordinated Views • Everything is designed around “clusters of buildings” • Coordinate clusters using colors • Proximity – Gradient from Red to Blue • Selection - White
Legible Cities:Querying • Identifying areas with specific attributes
Legible Cities:How To Use the System • Using 2000 US Census Data of Charlotte (Mecklenburg County) NC • Looking at: • Ethnicity • Citizenship status • Income • Housing Information • etc. • Other dimensions can be used: • Crime rate, traffic, etc
Legible Cities:Scenario 1: Identifying Neighborhoods • Task: Find areas around downtown Charlotte with high Hispanic populations • Select in the parallel coordinates view… • Finding additional information about High Hispanic population regions • Correlations with other dimensions…
Legible Cities:Scenario 3: Comparing Regions Davidson, NC Downtown Charlotte, NC
Legible Cities:Expert Evaluation • With 14 Expert Geographic Information System (GIS) Users • Center of Real Estate at UNC Charlotte • UNC Charlotte Urban Institute • Charlotte Mecklenburg County GIS Office • Charlotte Mecklenburg County Planning Department • Charlotte Mecklenburg County School Systems • Private Real Estate Developers • Feedbacks are very positive… • “Your tool is providing an on-the-fly, interactive way of noticing nearby statistical data and their relationships” • “Your focus area and peripheral areas are cohesively orientated… Changing the level of detail in other software programs is cumbersome [because it requires] running multiple repetitive queries...”
Legible Cities:Summary • Urban Visualization • Geometry • Information • View Dependence • Contribution • Interpretation and visual implementation of Architectural theories • Implementing urban theories that are qualitative by nature • View-Dependent, Multi-Resolution display • Don’t have to zoom in and lose contextual information • Allows the user to explore the city while retaining spatial awareness
Questions? • Thank you! www.viscenter.uncc.edu
Legible Cities : Three Modalities • “New York is large, compact, and crowded.” • “The area where I live there has a strong mix of ethnicities.” • Geometric • Information • Focus Dependent
Legible Cities:Information Theory - Koolhaas • Rem Koolhaas • Economic and Political Issues • Study of Symbolism • Information Overlay • City.org Approach Rem Koolhaas. S,M,L,XL. New York: The Monacelli Press, Inc., 1998