Download
1 / 73
730 likes | 844 Views
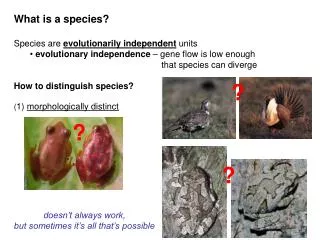
What is a species?. What is a species?. Pre-mating isolating mechanisms. a) Temporal isolation. b) Ecological isolation. c) Behavioral isolation. d) Mechanical isolation. 2) Post-mating isolating mechanisms.

E N D
What is a species? • Pre-mating isolating mechanisms. • a) Temporal isolation. • b) Ecological isolation. • c) Behavioral isolation. • d) Mechanical isolation. • 2) Post-mating isolating mechanisms. • a) Gametic incompatibility. b) Zygotic mortality. c) Hybrid inviability. d) Hybrid sterility. e) Hybrid breakdown.
Population Ecology • Population (N) • Group of animals, identifiable by species, place, and time • Defined by population biology • Genetic definition would be more specific • Individuals comprise a population • Collective effects of individuals • Natality, mortality, rate of increase • Most management = • Populations • not individuals
Rates • Natality • Births (per something) • Mortality • Deaths (per something) • Fecundity • Ability to reproduce • Number of eggs • Female births/adult female • Productivity • Number of young produced • Breeding system, sex and age ratios • Recruitment (net growth = R)
Definitions • Age structure • Number of individuals in different age classes • Sex ratio • Male:female • Buck only deer hunting 1:3 • QDM at Chesapeake Farms 1:1.5 • Some dabbling ducks 10:1
Age Pyramids Long lived, slow turnover, low productivity, high juvenile survival Short lived, fast turnover, high productivity, low juvenile survival
Age Pyramids Long lived, slow turnover, low productivity, high juvenile survival Short lived, fast turnover, high productivity, low juvenile survival US population age pyramids
Sex Specific Age Pyramid males females Buck only hunting Age pyramid
Population Growth – 2 main models Exponential Growth Logistic Growth • Assumes resources unlimited • Considers carrying capacity
Population Growth • Lambda • Measure of population growth • Ratio of population sizes – No Units • >1 population is growing • <1 population is declining • Important measure of pop status
Demographic Rates • Birth rate (b) • Death rate (d) • Emigration (e) • Immigration (i) • Realized population growth rate r
Population Growth • r • actual growth rate of population • birth rate – death rate (Exponential Model) • (Birth rate + immigration rate) – (death rate + emigration rate) - > more realistic
Exponential Growth • Constant per capita rate of increase (r) • Constant percentage increase • Ex: 10% per year • Text • “ever-increasing rate” per unit time • Means number added per unit time is ever-increasing • Population growth model
Population of 100 individuals (N) • Each individual can contribute 1/3 (0.33) of an individual to the population in a given unit of time (r) • What is rN? • ΔN/Δt? • Nt+1 ?
Exponential Growth • GeorgeReserve example • Dr. Dale McCullough • Estimated per capita growth rate for unencumbered growth (rm) • New species in optimal habitat • Maximum per capita growth rate • Why estimate it?
Problems with Exponential Growth Model • Assumes unlimited resources for population growth • Birth rates and death rates remain constant When is this true??
Quiz • T/F? Both lambda and r increase through time in the exponential growth model. • T/F? Both lambda and r change through time in the logistic growth model. • Humans have a Type I survisorship curve • Are feral cat killings of songbirds a type of compensatory or additive mortality?
Logistic Growth Model • Why worry about this? • Fundamental conceptual relationship that underlies sustained yield harvesting • NC deer population • 1.1mm • Harvest 265,000 • Is that harvest a lot, a few? • Will the population increase, decline, or what? • Simple mathematical model
Logistic Growth Model • Parameters have intuitive biological meaning • K = carrying capacity • N = population size • rm = maximum per capita intrinsic growth rate (potential) • Species and habitat specific • r = realized (actual) per capita growth rate • For exponential growth r = rm • Only occurs for small populations for a short time • McCullough should have estimated rm
Logistic Growth Model • One specific form of sigmoid growth • Growth model • R = net growth = recruits • K = carrying capacity • r = realized growth rate
Logistic Growth Model • As N approaches K, r = 0 • When N small, then r = rm
Logistic Growth Model Density-dependent growth
Year Recruits Residual N r N + 1 3 9 0.333 12 2 4 12 0.333 16 3 5 16 0.313 21 4 7 21 0.333 28 5 9 28 0.321 37 6 12 37 0.324 49 .. .. .. .. .. 20 11 371 0.030 382 21 8 382 0.021 390 22 6 390 0.015 396 23 3 396 0.008 399 24 1 399 0.003 400 25 0 400 0.000 400
r vs population size dN/dt = rN(K-N)/K population size versus time # Recruits vs population size
Density Dependent Growth Fundamental relationship that underlies sigmoid growth. As N increases, per capita growth r decreases. Density-dependent factors vs density-independent factors
Density Dependent Growth • Combined effects of natality and mortality • Births decline as N increases above a certain point • Deaths increase as N increases above a certain point
Density Dependent Growth • Residual population (N) • Population size which produces the recruits (R) • Pre-recruitment population • Stock population • Birth pulse population • Births occur about the same time • Deer in spring
Sustained Yield • Inflection point (I) • Sigmoid curve slope changes from positive to negative • Peak hump-shaped SY (or R) curve • Maximum R per unit time • Point of MSY (K/2) Population Growth
George Reserve Deer r per capita growth, h is per capita harvest rate Hump-shaped, not bell-shaped
George Reserve Deer MSY occurs at the inflection point I
George Reserve Deer Theoretically, sustainable harvests range from 0-90%; MSY about 50%
George Reserve Deer negative feedback between N and R Right side of MSY (I) stable
George Reserve Deer Positive feedback between N and R Left side of MSY (I) unstable
Logistic Growth Assumptions • All individuals the same • No time lags • Obviously, overly simplistic • Does provide conceptual bases for management.
Population Models • Forces thinking • Conceptual value • Requires data • What needs to be known? • How are those data acquired? • Predict future conditions • Assess management alternatives
NC Deer NC deer population 1.1mm Harvest 265,000 Can this model suggest anything about the harvest level in NC?
NC Deer NC deer population 1.1mm Harvest 265,000
Density Dependent Factors • Density dependent (proportional) • Mortality • Natality • Density independent • Asian openbill storks example • Compensatory mortality and natality
A population of Spotted Fritillary butterflies exhibits logistic growth. If the carrying capacity is 500 butterflies and r = 0.1 individuals/(individuals x month), what is the maximum population growth rate for the population? (Hint: maximum population growth rate occurs when N = K/2).
In the question you're given the following information: K = 500 r = 0.1 maximum population growth at K/2 Therefore, the maximum population size = K/2 = 500/2 = 250 dN/dt = rN[1-N/K] - this is the logistic growth equation dN/dt = (0.1)(250) [1 - (250)/500)] dN/dt = 12.5 individuals/month