Download
1 / 37
460 likes | 824 Views
Chapter 7S Capacity and Constraint Management Outline. Capacity Design and Effective Capacity Capacity and Strategy Capacity Considerations Managing Demand Demand and Capacity Management in the Service Sector. Outline – Continued. Bottleneck Analysis and Theory of Constraints

E N D
Chapter 7S Capacity and Constraint ManagementOutline • Capacity • Design and Effective Capacity • Capacity and Strategy • Capacity Considerations • Managing Demand • Demand and Capacity Management in the Service Sector © 2011 Pearson Education, Inc. publishing as Prentice Hall
Outline – Continued • Bottleneck Analysis and Theory of Constraints • Process Times for Stations, Systems, and Cycles • Theory of Constraints • Bottleneck Management • Break-Even Analysis • Single-Product Case • Multiproduct Case © 2011 Pearson Education, Inc. publishing as Prentice Hall
Outline – Continued • Reducing Risk with Incremental Changes • Applying Expected Monetary Value to Capacity Decisions • Applying Investment Analysis to Strategy-Driven Investments • Investment, Variable Cost, and Cash Flow • Net Present Value © 2011 Pearson Education, Inc. publishing as Prentice Hall
Learning Objectives Define capacity Determine design capacity, effective capacity, and utilization Perform bottleneck analysis Compute break-even analysis Determine the expected monetary value of a capacity decision Compute net present value © 2011 Pearson Education, Inc. publishing as Prentice Hall
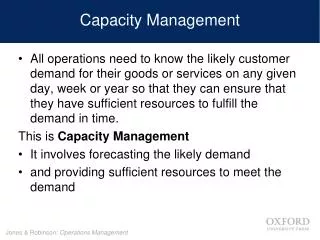
Process Strategies The objective of a process strategy is to build a production process that meets customer requirements and product specifications within cost and other managerial constraints © 2011 Pearson Education, Inc. publishing as Prentice Hall
Options for Adjusting Capacity * Long-range planning Add facilities Add long lead time equipment Intermediate-range planning Subcontract Add personnel Add equipment Build or use inventory Add shifts Schedule jobs Schedule personnel Allocate machinery * Short-range planning Modify capacity Use capacity * Difficult to adjust capacity as limited options exist Planning Over a Time Horizon Figure S7.1 © 2011 Pearson Education, Inc. publishing as Prentice Hall
Design and Effective Capacity • Design capacity is the maximum theoretical output of a system • Normally expressed as a rate • Effective capacity is the capacity a firm expects to achieve given current operating constraints • Often lower than design capacity © 2011 Pearson Education, Inc. publishing as Prentice Hall
Utilization and Efficiency Utilization is the percent of design capacity achieved Utilization = Actual output/Design capacity Efficiency is the percent of effective capacity achieved Efficiency = Actual output/Effective capacity © 2011 Pearson Education, Inc. publishing as Prentice Hall
Bakery Example Actual production last week = 148,000 rolls Effective capacity = 175,000 rolls Design capacity = 1,200 rolls per hour Bakery operates 7 days/week, 3 - 8 hour shifts Design capacity = (7 x 3 x 8) x (1,200) = 201,600 rolls Utilization = 148,000/201,600 = 73.4% Efficiency = 148,000/175,000 = 84.6% © 2011 Pearson Education, Inc. publishing as Prentice Hall
Bakery Example Actual production last week = 148,000 rolls Effective capacity = 175,000 rolls Design capacity = 1,200 rolls per hour Bakery operates 7 days/week, 3 - 8 hour shifts Efficiency = 84.6% Efficiency of new line = 75% Expected Output = (Effective Capacity)(Efficiency) = (175,000)(.75) = 131,250 rolls © 2011 Pearson Education, Inc. publishing as Prentice Hall
Capacity and Strategy • Capacity decisions impact all 10 decisions of operations management as well as other functional areas of the organization • Capacity decisions must be integrated into the organization’s mission and strategy © 2011 Pearson Education, Inc. publishing as Prentice Hall
Capacity Considerations • Forecast demand accurately • Understand the technology and capacity increments • Find the optimum operating level (volume) • Build for change © 2011 Pearson Education, Inc. publishing as Prentice Hall
75 - room roadside motel 25 - room roadside motel 50 - room roadside motel Average unit cost (dollars per room per night) Economies of scale Diseconomies of scale 25 50 75 Number of Rooms Economies and Diseconomies of Scale Figure S7.2 © 2011 Pearson Education, Inc. publishing as Prentice Hall
Managing Demand • Demand exceeds capacity • Curtail demand by raising prices, scheduling longer lead time • Long term solution is to increase capacity • Capacity exceeds demand • Stimulate market • Product changes • Adjusting to seasonal demands • Produce products with complementary demand patterns © 2011 Pearson Education, Inc. publishing as Prentice Hall
Combining both demand patterns reduces the variation 4,000 – 3,000 – 2,000 – 1,000 – Snowmobile motor sales Sales in units Jet ski engine sales J F M A M J J A S O N D J F M A M J J A S O N D J Time (months) Complementary Demand Patterns Figure S7.3 © 2011 Pearson Education, Inc. publishing as Prentice Hall
Demand and Capacity Management in the Service Sector • Demand management • Appointment, reservations, FCFS rule • Capacity management • Full time, temporary, part-time staff © 2011 Pearson Education, Inc. publishing as Prentice Hall
Bottleneck Analysis and Theory of Constraints • Each work area can have its own unique capacity • Capacity analysis determines the throughput capacity of workstations in a system • A bottleneck is a limiting factor or constraint • A bottleneck has the lowest effective capacity in a system © 2011 Pearson Education, Inc. publishing as Prentice Hall
Process Times for Stations, Systems, and Cycles • The process time of a station is the time to produce a unit at that single workstation • The process time of a system is the time of the longest process in the system … the bottleneck • The process cycle time is the time it takes for a product to go through the production process with no waiting © 2011 Pearson Education, Inc. publishing as Prentice Hall
A B C 2 min/unit 4 min/unit 3 min/unit A Three-Station Assembly Line Figure S7.4 © 2011 Pearson Education, Inc. publishing as Prentice Hall
Process Times for Stations, Systems, and Cycles • The system process time is the process time of the bottleneck after dividing by the number of parallel operations • The system capacity is the inverse of the system process time • The process cycle time is the total time through the longest path in the system © 2011 Pearson Education, Inc. publishing as Prentice Hall
Order Bread Fill Toast Wrap 30 sec/sandwich 15 sec/sandwich 20 sec/sandwich 40 sec/sandwich 37.5 sec/sandwich Bread Fill Toast 15 sec/sandwich 40 sec/sandwich 20 sec/sandwich Capacity Analysis • Two identical sandwich lines • Lines have two workers and three operations • All completed sandwiches are wrapped © 2011 Pearson Education, Inc. publishing as Prentice Hall
Bread Fill Toast 15 sec 20 sec 40 sec Order Wrap 30 sec 37.5 sec Bread Fill Toast 15 sec 40 sec 20 sec Capacity Analysis • Toast work station has the longest processing time – 40 seconds • The two lines each deliver a sandwich every 40 seconds so the process time of the combined lines is 40/2 = 20 seconds • At 37.5 seconds, wrapping and delivery has the longest processing time and is the bottleneck • Capacity per hour is 3,600 seconds/37.5 seconds/sandwich = 96 sandwiches per hour • Process cycle time is 30 + 15 + 20 + 40 + 37.5 = 142.5 seconds © 2011 Pearson Education, Inc. publishing as Prentice Hall
Theory of Constraints • Five-step process for recognizing and managing limitations Step 1: Identify the constraint Step 2: Develop a plan for overcoming the constraints Step 3: Focus resources on accomplishing Step 2 Step 4: Reduce the effects of constraints by offloading work or expanding capability Step 5: Once overcome, go back to Step 1 and find new constraints © 2011 Pearson Education, Inc. publishing as Prentice Hall
Bottleneck Management • Release work orders to the system at the pace of set by the bottleneck • Lost time at the bottleneck represents lost time for the whole system • Increasing the capacity of a non-bottleneck station is a mirage • Increasing the capacity of a bottleneck increases the capacity of the whole system © 2011 Pearson Education, Inc. publishing as Prentice Hall
Break-Even Analysis • Objective is to find the point in dollars and units at which cost equals revenue © 2011 Pearson Education, Inc. publishing as Prentice Hall
Break-Even Analysis • Fixed costs are costs that continue even if no units are produced • Variable costs are costs that vary with the volume of units produced © 2011 Pearson Education, Inc. publishing as Prentice Hall
– 900 – 800 – 700 – 600 – 500 – 400 – 300 – 200 – 100 – – Total revenue line Total cost line Break-even point Total cost = Total revenue Profit corridor Cost in dollars Variable cost Loss corridor Fixed cost | | | | | | | | | | | | 0 100 200 300 400 500 600 700 800 900 1000 1100 Volume (units per period) Break-Even Analysis Figure S7.5 © 2011 Pearson Education, Inc. publishing as Prentice Hall
BEPx = break-even point in units BEP$ = break-even point in dollars P = price per unit (after all discounts) x = number of units produced TR = total revenue = Px F = fixed costs V = variable cost per unit TC = total costs = F + Vx F P - V BEPx = Break-Even Analysis Break-even point occurs when TR = TC or Px = F + Vx © 2011 Pearson Education, Inc. publishing as Prentice Hall
BEPx = break-even point in units BEP$ = break-even point in dollars P = price per unit (after all discounts) x = number of units produced TR = total revenue = Px F = fixed costs V = variable cost per unit TC = total costs = F + Vx BEP$ = BEPxP = P = = F P - V F 1 - V/P F (P - V)/P Break-Even Analysis Profit = TR - TC = Px - (F + Vx) = Px - F - Vx = (P - V)x - F © 2011 Pearson Education, Inc. publishing as Prentice Hall
BEP$ = = F 1 - (V/P) BEPx = = F P - V Break-Even Example Fixed costs = $10,000 Material = $.75/unit Direct labor = $1.50/unit Selling price = $4.00 per unit © 2011 Pearson Education, Inc. publishing as Prentice Hall
F BEP$= ∑1 - x (Wi) Vi Pi Break-Even Example Multiproduct Case where V = variable cost per unit P = price per unit F = fixed costs W = percent each product is of total dollar sales i = each product © 2011 Pearson Education, Inc. publishing as Prentice Hall
(a) Leading demand with incremental expansion New capacity Expected demand Demand (b) Capacity lags demand with incremental expansion (c) Attempts to have an average capacity with incremental expansion New capacity New capacity Expected demand Expected demand Demand Demand Reducing Risk with Incremental Changes Figure S7.6 © 2011 Pearson Education, Inc. publishing as Prentice Hall
Expected Monetary Value (EMV) and Capacity Decisions • Determine states of nature • Future demand • Market favorability • Analyzed using decision trees • Hospital supply company • Four alternatives © 2011 Pearson Education, Inc. publishing as Prentice Hall
Market favorable (.4) $100,000 Market unfavorable (.6) -$90,000 Large plant Market favorable (.4) $60,000 Medium plant Market unfavorable (.6) -$10,000 Small plant Market favorable (.4) $40,000 Do nothing Market unfavorable (.6) -$5,000 $0 Expected Monetary Value (EMV) and Capacity Decisions © 2011 Pearson Education, Inc. publishing as Prentice Hall
Strategy-Driven Investment • Operations may be responsible for return-on-investment (ROI) • Analyzing capacity alternatives should include capital investment, variable cost, cash flows, and net present value © 2011 Pearson Education, Inc. publishing as Prentice Hall
F (1 + i)N P = Net Present Value (NPV) In general: F = P(1 + i)N where F = future value P = present value i = interest rate N = number of years Solving for P: © 2011 Pearson Education, Inc. publishing as Prentice Hall
Limitations • Investments with the same NPV may have different projected lives and salvage values • Investments with the same NPV may have different cash flows • Assumes we know future interest rates • Payments are not always made at the end of a period © 2011 Pearson Education, Inc. publishing as Prentice Hall