Download
1 / 48
480 likes | 575 Views
This research explores texturing of layered surfaces to maximize shape perception. Previous experiments and data analysis are outlined, along with a follow-up study proposal for further exploration.

E N D
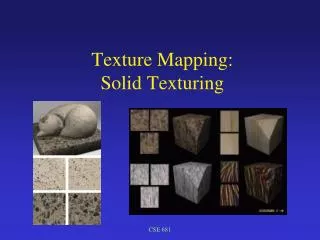
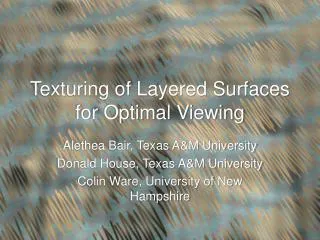
Texturing of Layered Surfaces for Optimal Viewing Alethea Bair, Texas A&M University Donald House, Texas A&M University Colin Ware, University of New Hampshire
Outline 1. Previous Work 2. Experiment 3. Data Analysis 4. Follow Up Study
Introduction • Problem: • Display layered surfaces. • Goal: • Maximize shape perception. • Texture has been shown to aid shape perception on a single surface. • But textures interact across 2 surfaces.
Previous Work • Human-in-the-loop Method: House, Bair, Ware. On the Optimization of Visualizations of Complex Phenomena, VIS 2005.
Previous Work • Human-in-the-loop Method: House, Bair, Ware. On the Optimization of Visualizations of Complex Phenomena, VIS 2005.
Previous Work • Human-in-the-loop Method: House, Bair, Ware. On the Optimization of Visualizations of Complex Phenomena, VIS 2005.
Previous Work • Human-in-the-loop Method: House, Bair, Ware. On the Optimization of Visualizations of Complex Phenomena, VIS 2005.
Previous Work • Human-in-the-loop Method: House, Bair, Ware. On the Optimization of Visualizations of Complex Phenomena, VIS 2005.
Previous Work • Human-in-the-loop Method: House, Bair, Ware. On the Optimization of Visualizations of Complex Phenomena, VIS 2005.
Previous Work • Human-in-the-loop Method: House, Bair, Ware. On the Optimization of Visualizations of Complex Phenomena, VIS 2005.
Issues with 2005 Experiment • Complicated textures • Fixed large-scale surface features • Subjective rating • Slow convergence • Resolution lowerthan human eye • Stereo glasses
Texture Parameterization • Reduced parameters from 122 to 26 • Grid layout • Size • Aspect ratio • Randomness • Color • Brightness • Roundness • Blur • Orientation • Opacity
Texture Parameterization • Reduced parameters from 122 to 26 • Grid layout • Size • Aspect ratio • Randomness • Color • Brightness • Roundness • Blur • Orientation • Opacity
Texture Parameterization • Reduced parameters from 122 to 26 • Grid layout • Size • Aspect ratio • Randomness • Color • Brightness • Roundness • Blur • Orientation • Opacity
Texture Parameterization • Reduced parameters from 122 to 26 • Grid layout • Size • Aspect ratio • Randomness • Color • Brightness • Roundness • Blur • Orientation • Opacity
Texture Parameterization • Reduced parameters from 122 to 26 • Grid layout • Size • Aspect ratio • Randomness • Color • Brightness • Roundness • Blur • Orientation • Opacity
Texture Parameterization • Reduced parameters from 122 to 26 • Grid layout • Size • Aspect ratio • Randomness • Color • Brightness • Roundness • Blur • Orientation • Opacity
Texture Parameterization • Reduced parameters from 122 to 26 • Grid layout • Size • Aspect ratio • Randomness • Color • Brightness • Roundness • Blur • Orientation • Opacity
Texture Parameterization • Reduced parameters from 122 to 26 • Grid layout • Size • Aspect ratio • Randomness • Color • Brightness • Roundness • Blur • Orientation • Opacity
Texture Parameterization • Reduced parameters from 122 to 26 • Grid layout • Size • Aspect ratio • Randomness • Color • Brightness • Roundness • Blur • Orientation • Opacity
Texture Parameterization • Reduced parameters from 122 to 26 • Grid layout • Size • Aspect ratio • Randomness • Color • Brightness • Roundness • Blur • Orientation • Opacity
Surface Generation • Surfaces have randomized, multi-scale features • Fractal-like cosine height fields • period varied from 50% to 1% of screen width. • 7 Gaussian bumps • bumps varied from 8% to 2% of screen width.
Rating Method • Rating objectivity improved. • Subjects gave 2 ratings of 0-9, one for each surface. • The rating was based on how well the subject could see all 7 bumps. • A combined rating was the product of the top and bottom surface ratings.
Speeding Human-in-the-Loop Evaluation • Genetic algorithm was modified using islanding • Subjects chose an excellent texture pair • A generation of highly-similar textures was produced around the subject’s choice. • Time for a trial was reduced from 3 hours to 1 hour.
Stereoscope Resolution Screens had a resolution of 3840 x 2400
Data Analysis Approach • 6 subjects rated 4560 visualizations • We derived guidelines from various data-mining techniques. • For this experiment, we used: • ANOVA • LDA • Decision Trees • Parallel Coordinates
ANOVA • Shows the significance of an individual parameter’s effect on the rating. median 1 quartile 1.5 quartile outlier +
Linear Discriminant Analysis • Determines parameter vectors that best separate good from bad visualizations.
Decision Tree Analysis • Determines the best parameter settings to classify visualizations by ratings.
Parallel Coordinate Analysis • Used to visually identify parameter trends Lines colored by top opacity
Guidelines for Texture Design • Bright top, and brighter bottom surfaces • Long, thin lines on top • Medium to high randomness • Prominent (large, bright, opaque) marks on top • Subtle (small, low opacity) marks on bottom • Either: • Medium top background opacity with medium-sized top marks or • Low top background opacity with large top marks • Little blur on top, more blur on bottom • Chroma can be freely chosen
Evaluating Guidelines • Experiment Used: • Decision tree rules to generate 29 visualizations: • (bad) 4 with rating 1.15 • (poor) 5 with rating 4.57 • (fair) 10 with rating 5.47 • (good) 10 with rating 8.06 • Parallel coordinate trends to generate 31 more: • (enhanced A) 20 (good + lines and background) • (enhanced B) 11 (good + large lines) • 6 Subjects Rated All 60 Visualizations.
Experimental Results • Subject Agreement • Correlations between subjects were greater than 0.57 for all subject pairings. • This has a p-value less than 0.0001.
Experimental Results • Agreement with predicted ratings. • Box plots show the distribution of ratings.
Losers! Rating 1.05 Rating 2.6
Winners! Rating 8.14 Rating 7.87
Future Work • Surface conforming textures • Exhaustive experiments in a constrained space • Printed media
Acknowledgments • National Science Foundation • Center for Coastal and Ocean Mapping, University of New Hampshire • Visualization Laboratory, Texas A&M University
Recap of Guidelines: • Bright top, and brighter bottom surfaces • Long, thin lines on top • Medium to high randomness • Prominent marks on top • Subtle marks on bottom • Either: • Medium top opacity with medium-sized marks or • Low top opacity with large marks • Little blur on top, more blur on bottom • Color can be freely chosen
Search Results • 6 subjects • 4560 different rated visualizations Final Database Random