Download
1 / 1
10 likes | 94 Views
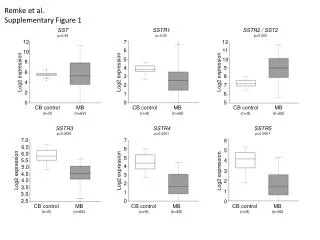
This supplementary figure displays the analysis of SSTR expression levels in cerebellar (CB) control and medulloblastoma (MB) cells. The data show significant differences in SSTR3, SSTR4, and SSTR5 expression between the two sample groups. Log2 expression values are presented for detailed comparison.

E N D
Remke et al. Supplementary Figure 1 SST p=0.49 SSTR1 p=0.39 SSTR2 / SST2 p=0.003 12 7 12 6 11 10 5 10 8 4 9 6 Log2 expression Log2 expression Log2 expression 3 8 4 2 7 2 1 6 0 0 5 CB control (n=9) MB (n=62) CB control (n=9) MB (n=62) CB control (n=9) MB (n=62) SSTR3 p<0.0001 SSTR4 p<0.0001 SSTR5 p<0.0001 7.0 7 6 6.5 6 5 6.0 5 4 5.5 4 5.0 Log2 expression Log2 expression 3 Log2 expression 4.5 3 4.0 2 2 3.5 1 1 3.0 0 2.5 0 CB control (n=9) MB (n=62) CB control (n=9) MB (n=62) CB control (n=9) MB (n=62)