
Comparing Whole-Word Measures in Children with Cochlear Implants
This study explores the performance of children with cochlear implants on whole-word measures, focusing on their language development compared to newly established reference data for typically developing two-year-olds. A total of 19 conversational speech samples from seven children were analyzed, revealing variations in the Proportion of Whole-Word Proximity (PWP) and Proportion of Whole Words Correct (PWW). Results suggest that greater cognitive maturity and implant experience may correlate with higher word accuracy. The findings emphasize the importance of continued monitoring and support for language development in this population.

Comparing Whole-Word Measures in Children with Cochlear Implants
E N D
Presentation Transcript
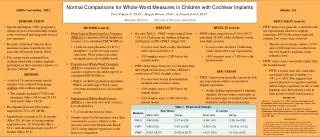
Normal Comparisons for Whole-Word Measures in Children with Cochlear Implants Peter Flipsen Jr., Ph.D.1, Maggie Watson, Ph.D.2,, & Pamela Terrell, Ph.D.2 1Idaho State University 2University of Wisconsin – Stevens Point ASHA Convention, 2012 Atlanta, GA • INTRODUCTION • Ingram and Ingram (2001) proposed a change in focus from individual sounds to the word level and suggested several new measures. • Recently “reference” data for these measures became available for two year-olds (Watson & Terrell, 2012). • The current study examined how children fitted with cochlear implants performed on these measures relative to the new “normal” data. • METHOD • A total of 19 conversational speech samples were collected from seven children with cochlear implants. • The samples included 57-243 total utterances (Mn = 144.6) and 70-633 total words (Mn = 333.9) • Pre-implant (best ear) PTA values ranged from 70 to 103 dB HL. • Implantation occurred at 20-42 months (Mn= 28). At time of testing implant experience was 22-39 months (Mn= 32.1), and chronological age was 45-75 months (Mn = 60.4). • DISCUSSION (cont’d) • PWP values were generally consistent with age expectations relative to implant experience BUT both extreme high and extreme low values were observed. • The two most extreme values (-15.79 and +10.02) may have resulted from the very limited variability in the reference data. • PWW values were consistently higher than the normal means. • PWW z-scores were also somewhat associated with age at testing (r = .447, p = .055). This suggests that greater physical or cognitive maturity and/or longer experience in life or with language may have played a role in their greater overall word accuracy. • REFERENCES • Ingram, D., & Ingram, K. D. (2001). A whole-word approach to phonological analysis and intervention. Language, Speech, and Hearing Services in Schools, 32, 271-283 • Watson, M. M., & Terrell, P. (2012). Longitudinal Changes in Phonological Whole-Word Measures in 2-year olds: A Longitudinal Investigation. International Journal of Speech-Language Pathology, 14(4), 351-362. • METHOD (cont’d) • Phonological Mean Length of Utterance (PMLU) is a measure of both length and accuracy. It is calculated PER WORD as: • 1 point for each phoneme (Cs & Vs) attempted + 1 point for each correct consonant. Word values were then averaged across all available words. • Proportion of Whole-Word Proximity (PWP) is a measure of length and accuracy relative to the adult target. It is calculated PER WORD as: • PMLU of child’s production divided by PMLU of adult target. Word values were then averaged across all available words. • Proportion of Whole Words Correct (PWW) is a measure of overall accuracy. It is calculated as: • % of words that have no errors. • Sample values for the measures were then converted to z-scores relative to the reference data from Watson and Terrell (2012) using implant experience as the basis for comparison. • RESULTS • See also Table 1. PMLU values ranged from 3.21 to 6.28 placing the children in Ingram and Ingram’s (2001) PMLU Stages I-IV. • Z-scores were fairly evenly distributed with a mean just below 0. • 5/19 samples were > 2 SD below the normal means. • PWP values range from 0.67 to 0.98 indicating that length and accuracy of these children’s words were 67-98% of adult values. • Z-scores were evenly distributed but included some extreme values. • 4/19 samples were > 2 SD below the normal means. • 2/19 samples were > 2 SD above the normal means. • RESULTS (cont’d) • PWW values ranged from 31.82 to 89.73 indicating 32-90% of the children’s words were fully accurate. • Z-scores were all above 0 indicating values much above age-expectations. • 14/19 samples were > 2 SD above the normal mean. • DISCUSSION • PMLU values were generally consistent with age expectations relative to amount of implant experience. • Of the children represented by multiple samples, all were either consistently in the normal range or trended from below normal to within the normal range. Acknowledgments Many thanks to Julie Beeler, Velvet Buehler, Molly Erickson, Mark Hedrick, Marge Hudson, Gayla Hutsell, Kim Jenkins, Leslie Jolles, and Saneta Thurman for their assistance. Special thanks to Lana Colvard, Michelle LaGesse, and Rhonda Parker for participant testing, to Joel Blaiss and Lisa Moss for phonetic transcription, and to Erin Harty and Michelle Dykman for the whole word analysis of the samples. Many thanks also to the children and their parents who participated.


