Download
1 / 23
250 likes | 429 Views
End to End Process Control for Total Operational Excellence. Total Operational Excellence Conference 2012 Lis Mannes Friday August 24 th 2012. AGENDA. Food for Thought Aligning the operational strategy to business strategy Organise to win Multi Site Engagement Creating Sustainable

E N D
End to End Process Control for Total Operational Excellence Total Operational Excellence Conference 2012 Lis Mannes Friday August 24th 2012
AGENDA • Food for Thought • Aligning the operational strategy to business strategy • Organise to win • Multi Site Engagement • Creating Sustainable Operational Advantage
Australian Landscape 16 Manufacturing Sites in Australia (Further 3 in NZ)
Tip Top Australia Distribution Network Tip Top has one of the most extensive distribution networks in Australia, delivering fresh bread daily across the whole of Australia Number of daily serviced customer drops 18,000 Number of loaves of bread picked & delivered per week 8 million Furthest Customer serviced daily within a State 2,500 kms one way daily – Brisbane to Woolworths Weipa North Qld Kms travelled per week by bread trucks c 850,000 kms Number of Depots Nationally 102 Longest Feeder Trip into depot Brisbane to Townsville 2,880 klms return trip, 6 days PW
At The Table • Engagement • Education • More than just capital investment • Not just about cost reduction • Delivering on the consumer promise • Long term sustainability
Alignment of Operational Strategy to Business Strategy EXPLICIT
Alignment of Operational Strategy to Business Strategy IMPLICIT
Fuel for Growth Alignment of functional areas Production, Engineering, Supply Chain, Procurement, Quality, Safety Alignment of Regions with the Centre Asset Care Social and Ethical requirements Legal & Regulatory compliance Risk Management
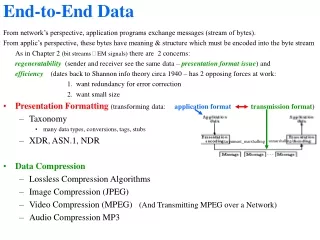
Plan On a Page Keeping it Simple & Transparent Direct Cascaded Link Appropriate Best Practice linked • Clarity of KPI • Measures • Collaborative • Development
Organise to WinBuilding Field & Central Alignment Collaborative Creation Individual Accountability Joint responsibility
Strategy Realisation Schedule Project Based Analysis & Delivery Leadership, Alignment & Systems based
Creating Operational Advantage Through an umbrella process delivery framework
What does good look like? Site B Simple but Limited Model Site A Site C
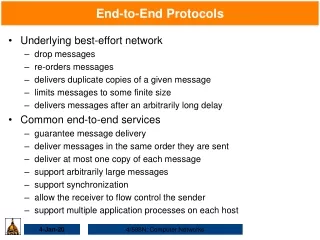
Multi SiteChallenges • Many dependent processes and systems to align • Sites move at different paces, different history, capabilities • and challenges • Resources often limited and have to be deployed selectively • Q • How do we objectively understand where our sites are? • How do we harness achieve best practice transfer between locations? • How do people understand the end game and what good looks like?
So How Do You Express the Journey? One option is to redevelop every year • Great for capturing new project • based activities • Ensures alignment with a changing • business strategy • More challenging for process • deployment and best practice • implementation • Team can’t see where they are going Year 4 POP Year 3 POP Year 2 POP Year 1 POP
Creating Clarity & TransparencyIdentifying what good looks like! • Needed an additional frame of reference • Individual journeys for each key process & metrics of achievement • Collaboration around Creation – Team development Asset Care Best Practice Lean Manufacturing Tool Deployment
Maturity Curves - Spider / Radar diagrams Becoming increasingly common Visual and easy to understand
Compare and Track Compare Several Sites
Our Alignment Model • Cascade from Board to Shop Floor • Simplicity • Collaboration & Transparency • Functions • Regions to Centre • Frameworks for • In Year & The Journey • Strategy realisation