
Understanding the Average Rate of Change: Linear and Exponential Functions
This educational material explores the concept of the average rate of change, focusing on its application to linear and exponential functions. It provides essential formulas, examples from graphs, and intervals for calculating rates of change. The resource includes practical exercises, such as determining the rate of change of student enrollment at Copper Basin High School from 1991 to 1997, encouraging students to determine if this behavior models a linear function. Perfect for improving comprehension in mathematical analysis.

Understanding the Average Rate of Change: Linear and Exponential Functions
E N D
Presentation Transcript
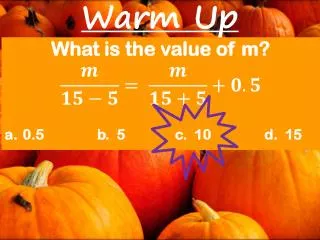
Warm Up What is the value of m? • 0.5 b. 5c. 10d. 15
Average Rate of Change Unit 5 Notes
Formula (Change in y over Change in x)
Constant vs. Variable Rate of Change Constant Variable
Ex.1 From a Graph LINEAR Part (a) Part (b)
Ex.2 From a Graph EXPONENTIAL Do we need an interval To calculate rate of change for linear functions? Part (b) Part (a) Interval: Interval:
Ex.3 From a Graph OTHER Part (a) Interval:
Ex.4 From an Equation Part (a) Interval:
Ex.4 From an Equation Part (b) Interval:
Ex.4 From an Equation Part (c) Interval:
Ex.5 From a Table The chart below outlines student enrollment at Copper Basin High School. Calculate the rate of change from 1991 to 1997. Is this a linear function??
Homework Handout!


