Download
1 / 13
130 likes | 284 Views
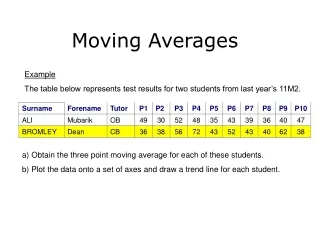
1981-2010 Averages. CRFS November 8, 2011. Preliminary Data 18% reduction in mean. Preliminary Data 4% reduction in mean. Preliminary Data 6% reduction in mean. Preliminary Data 6% reduction in mean. 3 Gage Method Mass Balance: 71-00 = 7927 MAF 81-10 = 7158 MAF Preliminary Data

E N D
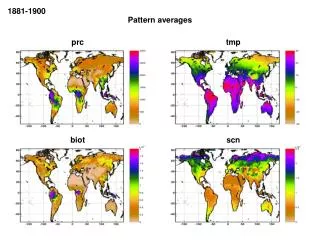
1981-2010 Averages CRFS November 8, 2011
Preliminary Data • 18% reduction in mean
Preliminary Data • 4% reduction in mean
Preliminary Data • 6% reduction in mean
Preliminary Data • 6% reduction in mean
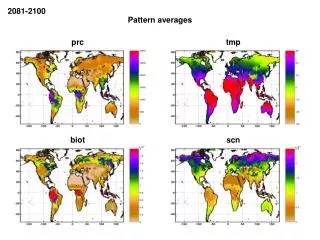
3 Gage Method • Mass Balance: • 71-00 = 7927 MAF • 81-10 = 7158 MAF • Preliminary Data • 11% reduction in mean
Effect on Forecasts • WY2012 forecasts will be based on 1981-2010 inputs in both forecast models • ESP and SWS will both use the same period • SNOTEL network much stronger for 1981-2010 period than in 1970s. This network is critical for forecast skill. • All things equal, these forecasts will be lower since input data sets are drier in the 30 year average • Especially true in early season forecasts • Later season forecasts more controlled by observed snowpack • Percent of normal forecast values should remain largely unchanged (since normals AND forecasts will be lower)
Example: ESP forecastsMean influence to early season forecasts somewhat less
Example: ESP forecastsMean influence to late season forecasts small