Download
1 / 8
80 likes | 221 Views
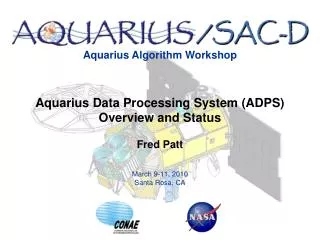
March 9-11, 2010 Santa Rosa, CA. Aquarius Algorithm Workshop. Aquarius Health and Performance Trending and Display Liang Hong Norman Kuring. Outline Offline instrument state-of-health monitoring and performance tracking In parallel with science data processing (after L1A) Input

E N D
March 9-11, 2010 Santa Rosa, CA Aquarius Algorithm Workshop Aquarius Health and Performance Trending and Display Liang Hong Norman Kuring
Outline Offline instrument state-of-health monitoring and performance tracking In parallel with science data processing (after L1A) Input Science and Aquarius HKT from L1A SAC-D telemetry from low rate HKT Web-based output Automated report on HKT alarm/trend and science (e.g. radiometer gain) check for each orbit Interactive display of HKT/science time series plot Under test and tuning since ATLO http://aquarius.gsfc.nasa.gov/cgi/hkt Aquarius Analysis Tool
Aquarius HKT Web-based Display • 421 Aquarius telemetries • 18 groups of sub-systems, e.g. ATC, radiometer 1~3, scatterometer and etc. • Color of menu reflects alarm status of specified time period • Plot features: adjustable temporal scales; alarm zone indication; averaging of data and etc. • In plan: relevant S/P telemetry (~200); selected raw/intermediate science data; command logs and etc.
Radiometer Analysis Tool • Outline • Offline radiometer health assessment and performance evaluation • Used for new algorithm and analysis tool test; cross check on implementation of ADPS elements; instrument problem diagnosing • Input • Aquarius High rate data • Low rate HKT (capable) • Output • Raw, intermediate, processed telemetry and science data • Versatile plots of selected data, e.g. composite time series, scatter plot, function of a set of data • Checks on memory dump, RFI test, expected gain, operating LUT and etc. • Reports on radiometer health and performance with comparison to past experiments, NEDT and etc. • Operational since radiometer I&T and available throughout mission