Download
1 / 23
240 likes | 331 Views
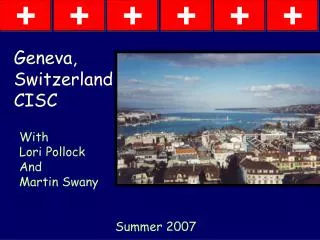
Zoltan Toth (NOAA/OAR/ESRL/GSD, Boulder, CO) Acknowledgements:

E N D
Zoltan Toth (NOAA/OAR/ESRL/GSD, Boulder, CO) Acknowledgements: Richard Swinbank, Steven Albers, Yuanfu Xie, Roman Krzysztofowicz, Louis Uccellini, Stephen Lord, Manuel Pondeca, Geoff Manikin, Andre Methot, Tom Hamill, Kathy Gilbert et al. Bo Cui, Yuejian Zhu, Paul Schultz, Mike Charles, Joo-Hyung Son, Dingchen Hou, Malaquias Pena, Huiling Yuan GIFS-TIGGE WG MEETINGFEB 22-24 2010, GENEVA, SWITZERLAND
GIFS QUESTIONS • WHAT do we want to achieve? • Generate ensemble-based probabilistic forecast products for high impact events • WHY do we need this? • Many user groups, especially in developing regions, have no access to such forecasts • WHO will contribute? • Global & regional NWP centers, users in developing regions, research & development groups • HOW can we proceed? • Identify pressing open science questions, promote related research • Identify IT needs • Ensemble data access • Shared development and use of algorithms / software • Shared production of probabilistic forecasts • On schedule and on demand distribution of products • Use best available algorithms • WHERE to test first? • HOW do we measure success? • New products made available to users in developing regions • Socio-economic value of newly introduced products assessed • Value added from improved algorithms assessed
HEPEX • Hydrological Ensemble Prediction EXperiment • Somewhat informal collaborative experiment • Initiated and led by John Schaacke • Series of Workshops • Last in Toulouse, June 2009 • Diverse interests • Promote use of ensemble techniques in hydrological forecasts • HEPEX community could become • Important user of TIGGE database • Collaborator in GIFS development • Ways to explore linkages • Make HEPEX more focused and/or more formalized? • Identify HEPEX-related activities promising for collaboration with GIFS?
DEVELOPMENTAL TEST CENTER (DTC)ENSEMBLE TESTBED (DET) • US interagency initiative • To test readiness of promising ensemble methods for transitioning to operations • Components • Ensemble configuration • Initial perturbations • Model related error representation • Statistical post-processing • Product generation • Verification • Application areas include • Hydrometeorology Testbed (HMT) • Hazardous Weather Testbed (HWT) • Hurricane Forecast Improvement Program (HFIP) • NCAR & NOAA contributions • NOAA OAR Global Systems Division (GSD) key player • Potential links with GIFS development
GIFS 101 • Pull talents / methods together from • Global, regional, national centers / levels • Build / share central depository • Toolbox for basic statistical post-processing / probabilistic products • Configure infrastructure for • Collaborative generation of basic ensemble / probabilistic info • Derive user relevant info from basic products • For each (SW)FDP for regional needs • For cities, temporal / spatial accumulations etc
PROBLEMS FOR GIFSPREDICTANDS • Identify predictands • Strike probability for TCs (65 nm / 120 km) • Based on cxml data – sequence of 6-hrly gridded output • 10 m wind gridded probability distributions • Simpson scale thresholds • Gridded precipitation amount probability distribution • Define predictands • Create gridded fine resolution observational analyses • Precipitation – Global, enhanced for selected regions • Wind – Global, enhanced for selected regions • Produce best possible basic products (next page)
QUALITY USER REQUIREMENTS • Statistical resolution • Seek highest possible skill in ensemble of forecasts • Need to extract and fuse all predictive information • Statistical reliability • Need to make ensemble members statistically indistinguishable from nature
PROBLEMS FOR GIFSSTATISTICAL POST-PROCESSING • Lead-time dependent errors • Due to start of imperfect model from close to observed state • Bias correct forecasts using hind-cast sample • Various sources of forecast information • Extract & combine forecast info from different sources • Variables of interest not predicted • Models have coarse resolution, lack user relevant variables • Map coarse model variables onto fine resolution user relevant variables
ESTIMATED BIAS – 2m Temperature, 5-d forecast BEFORE AFTER BIAS CORRECTION Bo Cui
IMPACT OF BIAS CORRECTION ON ESTIMATED SYSTEAMTIC ERROR PROBABILISTIC SCORES NH 500hPa height 850hPa temperature Before bias correction (1x1) NH 500hPa height After bias correction (1x1) NH 2m temperature Tropics 500hPa height Before Bias Correction After Bias Correction Bo Cui
00hr GEFS Ensemble Mean & Bias Before/After Downscaling 10% 2m Temperature 10m U Wind Before Before After After
Accumulated Bias Before/After RTMA Downscaling black red blue Black- operational ensemble mean, 2% Pink- bias corrected ens. mean after downscaling, 5% Red- NAEFS bias corrected ensemble mean, 2% Blue-bias corrected ens. mean after downscaling, 2% Yellow-bias corrected ens. mean after downscaling, 10%
CONTINUOUS RANKED PROBABILITY SCORE RAW / BIAS CORR. & DOWNSCALED& HIRESMERGED / NAEFS NCEP/GEFS raw forecast High resolution control & Canadian ensemble adds significant value => 8-day total gain in skill 8+ days gain NAEFS final products From Bias correction (NCEP, CMC) Dual-resolution (NCEP only) Down-scaling (NCEP, CMC) Combination of NCEP and CMC
Global Analysis and Prediction System GLAPS Steve Albers, Isidora Jankov, John McGinley and Zoltan Toth Sfc Temperature, MSLP
Current GLAPS Status • GLAPS is an implementation of the • Local Analyses and Prediction System (LAPS) currently running over a global domain. • As a GLAPS first guess the global FIM (with options for GFS and/or ECMWF) is being used. • An operational version of GLAPS is running with a grid spacing of 21 km on a lat-lon grid projection. • The analysis is being produced in real time on an hourly basis. • The output is distributed via web interface and with Science On a Sphere. 500 mb HT, |v|
Justifications • GLAPS can be used to … • Demonstrate the inventory of all global data available from GSD/ITS. • Provide a global view of fields of interest for weather and climate nowcasting. • Verify global/climate models by providing analyses of common meteorological and geophysical fields. • Initialize global models using both conventional and unconventional data sources (e.g. SST, ozone, algae blooming etc). • Run OSSE experiments for: initialization, verification, and simulated observation generator.
Future efforts • Improvement in runtime efficiency and corresponding decrease in grid spacing. • Interface with global observational datasets as they become available at ESRL/GSD (e.g. satellite). • Continue development on cylindrical equidistant (lat-lon) or icosahedral projection. • Initialization (hot-start) of FIM, transition to holistic models. Green Fraction Climatology
STMAS surface analysisfor FAA/MIT storm boundary detection • Sequential variational approach • New multigrid technique • Spatiotemporally consistent surface analysis • 15 or 5 min frequency • All surface data used • Including ASOS with 5 min frequency • Full 4D version under development and testing Black/white image: Frontal derived from STMAS Blue/read curve: HPC frontal analysis.
White Green Yellow
TIGGE-LAM QUESTIONS / ISSUES • Recognize fine resolution global ensemble is first choice • LAM ensemble used out of necessity – limited CPU resources • Decide on focus for TIGGE-LAM / LAM ensemble efforts • Fine scale predictability (whether resolved with global or LAM models)? • With increasing CPU, global models’ resolution improves • Use of one-way coupled regional models in ensemble forecasting? • Distinguish between use of LAMs for • Forecasting – initial value dependence / sensitivity – fight against chaos • Short lead time only (depending on domain size & level of chaos) • Dynamical downscaling – No sensitivity to initial conditions • Use finer resolution model to interpret forecast made at lower resolution • Compare two types of downscaling • Dynamical - use of LAM • Very expensive • Statistical resolution unchanged(?) • Statistical corrections still needed • Statistical – based on a sample of data • Limited by sample size • Cheap
TIGGE-LAM QUESTIONS / ISSUES - 2 • What is downscaling? • Find mapping between large and small scales • Identify small scales consistent with large scale flow • Some issues discussed in plan are NOT specific to LAM-EPS • Focus on TIGGE-LAM issues, work on other issues with GIFS-TIGGE WG? • Regional forecast applications • As default, work in framework of GIFS FDP (if present in regions)? • Engage with HEPEX and other regional initiatives • Standards for content and format of data important • How to represent model related uncertainty? • “…use of multiple models [to capture model related forecast uncertainty] has proven empirically valuable, but is likely not the best long term solution and in fact may be slowing our efforts to find the best model”