DATA QUALITY, COMPOSITE INDICATORS AND AGGREGATION
UPA Package 4, Module 2. DATA QUALITY, COMPOSITE INDICATORS AND AGGREGATION. Data Quality, Composite Indicators and Aggregation. Data errors Less is more; benefit-cost of data Data cleaning Composite indicators Introduction exercise 4.2.3 Exploring Data sets

DATA QUALITY, COMPOSITE INDICATORS AND AGGREGATION
E N D
Presentation Transcript
UPA Package 4, Module 2 DATA QUALITY, COMPOSITE INDICATORS AND AGGREGATION
Data Quality, Composite Indicators and Aggregation • Data errors • Less is more; benefit-cost of data • Data cleaning • Composite indicators • Introduction exercise 4.2.3 Exploring Data sets • Introduction exercise 4.2.4 Aggregation
Data Errors • Biased data • Outliers, error or extreme value • Sample too small • Too much precision or regularity (too good to be true) • Missing values • Inconsistencies
Quality (full coverage and maintenance) • Quantity (many variables but missing values and outdated) Physical Characteristics of a building Ownership Characteristics of a building Less is more; Benefit and Cost of Data
Benefit and Cost of Data • Data Benefit and Costs Strategy and clear objectives of developing databases Data (and functionalities) requirement study Data benefit, the value of information and quantification • costs reduction, effectiveness/priorities of (public) resource allocation • transparency, awareness, involvement Data costs high (acquisition, editing, conversion, updates, maintenance)
Benefit and Cost of Data Primary and secondary data, data sharing • Primary, ad-hoc, single use of data, (too) expensive • Secondary matching with requirement for poverty studies • Combination of existing data and samples • Data collection embedded into institutional settings, from data projects to data processes
Composite Indicators • Poverty without reliable income data • Slums • Composite Indicator Human Development Indicator, Poverty Index • Proxy indicators (consumption / income)
Aggregation • Aggregate cases into a single summary case • Break variable defines a group and create one case e.g. neighborhood • Aggregate functions Summary, fractions
Small Area Statistics • Limited (existing) data, limited funds for data collection • Sample survey and auxiliary data sets (+ analytical skills) = small area statistics • Developing a model to identify the relationship between the survey and the auxiliary data more reliable estimates can be made and the possibilities to extrapolate to areas not covered by a household survey
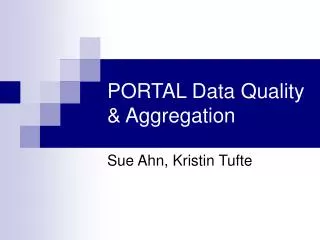
Introduction Exercise 4.2.3 Exploring Datasets Classifying interval data (number of foreigners, income, family size) into meaningful groups (e.g. low income, medium income, high income). Create cross tables and analyze relationships between these ordinal data sets.
Symmetric Measures Asymp. a b Value Std. Error Approx. T Approx. Sig. c Interval by Interval Pearson's R .309 .044 7.517 .000 c Ordinal by Ordinal Spearman Correlation .288 .042 6.956 .000 N of Valid Cases 538 a. Not assuming the null hypothesis. b. Using the asymptotic standard error assuming the null hypothesis. c. Based on normal approximation. Introduction Exercise 4.3.2 Count incomecl Total Low Medium High Very High housecl Low 37 50 25 0 112 Medium 51 177 182 0 410 High 1 1 8 6 16 Total 89 228 215 6 538 Cross table (mean income x mean house value) Municipalities in the Netherlands
Introduction Exercise 4.2.3 Aggregation Central Bureau of Statistics of The Netherlands three main spatial units: Municipality (n=538) Districts (n=2382) Neighbourhoods (n=10737) Aggregation, summarizing data, why and what Spatially homogenous versus heterogeneous variables Which statistics to use (mean or other statistical figures) Simple and weighted aggregates
Introduction Exercise 4.3.2 4.2.3 Data Quality, Composite Indicators and Aggregation 14