Download
1 / 18
180 likes | 353 Views
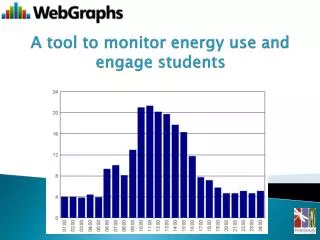
A tool to monitor energy use and engage students. Internet based reporting tool – www.webgraphs.com.au Provided by Ausgrid Business Services Daily Updates for most schools Easy to use interface Ability to view, save and print reports. Data can be easily exported to excel, word or pdf

E N D
Internet based reporting tool –www.webgraphs.com.au • Provided by Ausgrid Business Services • Daily Updates for most schools • Easy to use interface • Ability to view, save and print reports. Data can be easily exported to excel, word or pdf • Can subscribe to reports
Getting more from your schools electricity data • Understanding electricity usage in your school • Monitoring your usage can help you manage you use and save • Measure the effects of educating students on behaviours • Measure the results of retrofitting school buildings
Reports • For a range of parameters • For a range of reporting views and periods • 30 minute interval data for a day • Daily data for any period less than 2 months • Weekly data for any period less than a year • Monthly data for any period up to 5 years • Yearly data for up to 5 years
Bi-Directional Flow • Shows electricity generation and consumption on one report
Energy Consumption • Shows total energy used for the chosen period
Energy Consumption Activities • Analyse graphs and determine reasons for the shape of the graphs at different times. • Discuss why usage is high at certain times E.g. on hot day after lunch, all the classrooms turn on their air conditioners and brainstorm ideas for ways to reduce electricity consumption at these times. • Discuss why there is energy usage on weekends and possible ways to reduce this.
Get students to prepare a graph in excel comparing daily use yesterday and one year ago. • Discuss possible reasons for changes.
Graph energy use and temperature data. Discuss if there is any correlation between energy use and the weather (will be more appropriate for schools with a lots of air conditioners. • Temperature data from Bureau of Meteorology website www.bom.gov.au
CO2 Emissions • Shows total carbon emissions • Can input % green energy purchased to see how many tonnes are being saved
CO2 Emissions Activities • Compare the energy consumption for the same period and get students to determine the relationship between kW and tonnes CO2. • This could be a good way to introduce the enhanced greenhouse effect and global warming to students. • Brainstorm the ways CO2 is produced at school and in the community and the possible impacts.
TOU (Time of Use) Energy • Shows energy used at different times • There is a ‘school’ profile in each account • You can have up to three other TOU profiles, which you set up
TOU (Time of Use) Energy Activities • Get students to calculate the portion of energy use during school hours, out of school hours and on weekends. • Discuss why the school is using energy out of hours and on weekends. • Discuss ways your school could reduce this out of hours usage.
Electricity or Solar Generation • Shows electricity generated from the schools solar panels • Solar Generation shows temperature
Estimated data • Make sure your not using estimated data – marked ‘E’
www.webgraphs.com.au • Peter Troy is the DEC WebGraphs account administrator. He can be contacted on peter.troy1@det.nsw.edu.au • Username: School DEC ID • Password: To be provided by Ausgrid Business Services contact 1300 76 06 26 or email crm@ausgrid.com.au