Data Collection, Accuracy, & Precision
160 likes | 256 Views
Data Collection, Accuracy, & Precision. Data Collection. There is __ __ ____ as a perfect __________. Each measurement contains a degree of uncertainty due to the _____ of ________ and the people using them.

Data Collection, Accuracy, & Precision
E N D
Presentation Transcript
Data Collection • There is __ __ ____ as a perfect __________. Each measurement contains a degree of uncertainty due to the _____ of ________ and the people using them. • When an experiment is performed, it is necessary to _______ collect ____so that a correct ________ can be determined.
Aspects of Proper Data Collection • Things to be considered in collecting data: • Using the proper __ ______ • Example: centimeters, not inches • Recording units with each measurement • Always include _ ______!!! • Using the appropriate __________ • Example: graduated cylinder, not beaker
Aspects of Proper Data Collection (continued) • __________ reading the instrument • Example: knowing what each line on a metric ruler represents • Writing down the known ______ of the ________ plus the ________ digit • Example: making a length measurement, and estimating the last digit as either 0 or 5
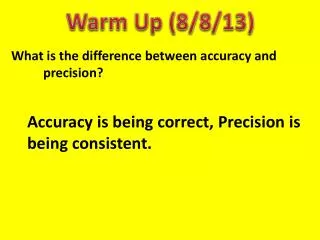
Accuracy & Precision • _______ is how _____ a measurement, or ___________ value, is to an accepted value, or ________. • ________is how close a set of measurements are to ____ ________.
Trends • When analyzing a graph, the ways that the data sets (dependent variable and independent variable) relate to one another are called ______ • Trends can also be seen as “________” in your data • Types of trends • ______ Relationship • ______ Relationship
_________ Relationship • When the dependent variable and the independent variable both ______/______
________ Relationship • When one of the variables _______ as the other __________
Stating the Trend • Instead of simply saying if a relationship is _______ or _______, we can put the _____ into a sentence using the format below: • As the “_______ ________” increases/decreases the “_________ __________” increases/decreases. (choose one) (choose one)
Practice • (independent variable) (circle one) • (dependent variable) (circle one) As the _____________ increases/decreases the _____________ increases/decreases. WRITE YOUR OWN TREND STATEMENT
Practice Based on your two trend statements, do you see a connection between the amount of rainfall and the number of Mosquito incidents?
What if there isn’t a distinct trend? • If you find that a trend is ___ clear with your graph, you should assess it based on where the pattern lies • Look at the _______/________ direction of the graph • Try to fit a line that will go in between the points… • And assess from there
Using Graphs • _____________ • the ability to __________ data within a given ______ of collected data
Using Graphs • ___________ • The ability to estimate data beyond the ________ of collected data