Visual Evaluation Experiment on Chroma Saturation Effects (Preliminary)
360 likes | 491 Views
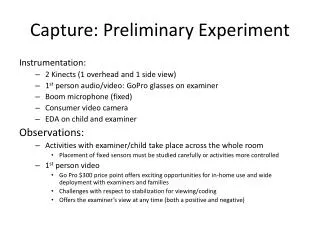
This report presents the preliminary findings of the Chroma Saturation Effects visual evaluation experiment, conducted at the NIST Spectrally Tunable Lighting Facility. The experiment utilized 22 color channels comprising high-power LEDs and evaluated color quality through a proposed Color Quality Scale (CQS). Key aspects include the introduction of saturated reference color samples to improve the conventional Color Rendering Index (CRI) and a focus on illumination levels influencing color perception. The study involved diverse subjects assessing various light conditions, highlighting the importance of saturation in color contrast and preference.

Visual Evaluation Experiment on Chroma Saturation Effects (Preliminary)
E N D
Presentation Transcript
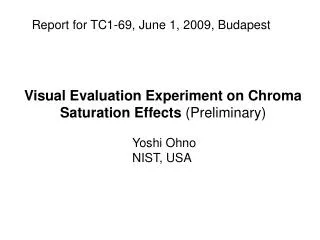
Report for TC1-69, June 1, 2009, Budapest Visual Evaluation Experiment on Chroma Saturation Effects (Preliminary) Yoshi Ohno NIST, USA
NIST Spectrally Tunable Lighting Facility for color rendering and vision science experiments
Specifications • 22 color channels using 1800 high power LEDs/unit (to be expanded) • 17 narrow bands + 5 broad bands (phosphor LEDs) • Each color channel has 5 to 10 W optical power. • Full power total optical power ~200 W, luminous flux ~50,000 lm. • 500 to 800 lx illumination for most of simulated white Light spectra.
“Color Quality Scale” Proposed by NIST • Fix the problems of CRI (based on color fidelity) 1) use 15 saturated reference color samples 2) use the latest color space (CIE LAB) 3) use the latest chromatic adaptation formula (CMCCAT2000) 4) 0 to 100 scale (CRI can have negative score.) 5) CCT factor based on gamut area of ref. Illuminant 6) RMS combining of color differences 7) Scale normalized for consistency with CRI for fluorescent lamps • Saturation factor – Considers the effect of enhanced color contrast. Davis, W. and Ohno, Y. “Development of a Color Quality Scale (CQS),” Proc., Sixth International Lighting Research Symposium on Light and Color, Orlando, FL, February 2006.
Ref Ref Test Test Saturation factor Score is not penalized for increase of chroma. (Score is decreased for hue and lightness shifts) Score is decreased for the full color difference
Experiments Lights tested • CCT: 4000 K (800 lx) and 3000 K (300 lx), Duv=0.000 • 4000 K 3000 K • Reference: broadband CRI Ra=98 Ra=97 • 4 peak (RGBA) Desaturated-4 Ra=70 Ra=70 • 4 peak (RGBA) Desaturated-3 Ra=77 Ra=76 • 4 peak (RGBA) Desaturated-2 Ra=84 Ra=84 • 4 peak (RGBA) Desaturated-1 Ra=90 Ra=90 • 4 peak (RGBA) Neutral Ra=92 Ra=95 • 4 peak (RGBA) Saturated-1 Ra=87 Ra=88 • 4 peak (RGBA) Saturated-2 Ra=82 Ra=81 • 4 peak (RGBA) Saturated-3 Ra=74 Ra=74 • 4 peak (RGBA) Saturated-4 Ra=69 Ra=69 8 Subjects: 5 Caucasians, 3 Asians / 5 females, 3 males Observation: 1) Look at the objects in the room (do not look at hands/face) 2) Look at your hands and face
Additional indices (CQS 7.4) Qa: General Color Quality Scale Qf: Qa without saturation factor Qp: Qa with positive saturation factor Qd: Relative gamut area of 15 samples
NIST Proposal • Color Quality Scale (CQS), Qa, for one number metric. • Additional metrics • 1) Color fidelity index (Qf or Ra) • 2) Color preference index (Qp)