Download
1 / 10
100 likes | 195 Views
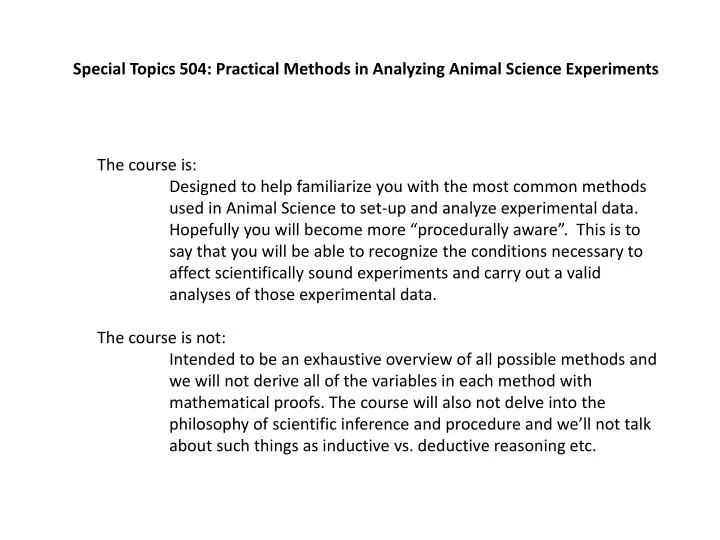
Special Topics 504: Practical Methods in Analyzing Animal Science Experiments. The course is:

E N D
Special Topics 504: Practical Methods in Analyzing Animal Science Experiments The course is: Designed to help familiarize you with the most common methods used in Animal Science to set-up and analyze experimental data. Hopefully you will become more “procedurally aware”. This is to say that you will be able to recognize the conditions necessary to affect scientifically sound experiments and carry out a valid analyses of those experimental data. The course is not: Intended to be an exhaustive overview of all possible methods and we will not derive all of the variables in each method with mathematical proofs. The course will also not delve into the philosophy of scientific inference and procedure and we’ll not talk about such things as inductive vs. deductive reasoning etc.
Special Topics 504: Practical Methods in Analyzing Animal Science Experiments You should already be familiar with: Types of data: nominal, ordinal, interval and ratio Frequency counts vs. Scores Continuous vs. Discrete data Descriptive statistics - means, modes, medians, variance, standard deviation, standard error, etc. Independence of variables, repeated and independent measures Parametric vs. Non-parametric data
Special Topics 504: Practical Methods in Analyzing Animal Science Experiments Differences between Parametric and Non-parametric Data Parametric Non-parametric Typical Data Ratio or Interval Ordinal or Nominal Assumed Distribution Normal Any Assumed Variance Homogenous Any Data Relationships Independent Any Central Measures Mean Median Usefulness Varied conclusions Simple; Less affected by outliers
Special Topics 504: Practical Methods in Analyzing Animal Science Experiments Testing Parametric vs. Non-parametric Data Parametric Non-parametric Independent Measures t-test Mann-Whitney test (of 2 groups) Independent Measures 1-way ANOVA Kruskal-Wallis test (of > 2 groups) Repeated Measures Matched-pair , t-test Wilcoxon test (with 2 conditions) Repeated Measures 1-way, repeated measures Friedman’s test (>2 conditions) ANOVA Correlation Pearson Correlation Spearman Rank test
Special Topics 504: Practical Methods in Analyzing Animal Science Experiments Testing Two Means Student’s t-Test This parametric test indicates the separation of two sets of measurements. It is a test to determine if two sets of measures are actually different and an experimental effect has been demonstrated. Typically this test is set up with a null hypothesis that indicates two measures (such as population or sample means) are the same. Ho: μ1 = μ2 or x̄1 = x̄2 “Two groups of dairy cows produce the same amount of milk on two different diets”
Special Topics 504: Practical Methods in Analyzing Animal Science Experiments Student’s t-Test The test assumes a normal distribution of the data, that the underlying variances are equal and there is random assignment of the measures. Actually, the t-distribution is the same as the normal (Z) distribution when n = ∞ With small sample sizes, the t distribution is “leptokurtic” (which is often the case with biological samples).
Special Topics 504: Practical Methods in Analyzing Animal Science Experiments Student’s t-Test The value of “t” or the “t statistic” is calculated : t = experimental effect / variability or t = the difference in group means / SE of difference between group means t = x̄ - μ S Looks a lot like a “Z” score!
Special Topics 504: Practical Methods in Analyzing Animal Science Experiments Student’s t-Test There are two basic types of t-tests: Independent measures – unmatched samples Matched-pair measures – samples are in pairs Independent Measures: two – sample test Tan k 1: fish grown without probiotic treatment on a normal diet. Tan k 2: fish grown with probiotic treatment on a normal diet. Ho: μ1 = μ2 or x̄1 = x̄2 All we need to generate a tscore and test whether fish in Tank 2 have grown differently than Tank 1 is an average of their weights (a mean) and the spread around that average (SD).
Special Topics 504: Practical Methods in Analyzing Animal Science Experiments Homogeneity of Variances An underlying assumption of the t-test and ANOVAs is that, σ21 = σ22 This is also an assumption for tests that examine more than two variances. So given that , we can test for the “Homogeneity of Variances” Ho: σ21 = σ22 = … = σ2k (where k is the number of samples) Ha: σ21 ≠ σ22≠ … When variances are equal they are said to be “Homoscedastic”.
Special Topics 504: Practical Methods in Analyzing Animal Science Experiments A Simplified Test for Homogeneity of Variances Divide the largest variance by the smallest variance to obtain an F-ratio. If the F-ratio is less than the value in the appropriate cell, you can assume the variances are homogeneous.


![Chapter 3: Simplex methods [Big M method and special cases]](https://cdn0.slideserve.com/517589/chapter-3-simplex-methods-big-m-method-and-special-cases-dt.jpg)