Download
1 / 10
100 likes | 181 Views
Guide on customizing Excel workbooks for statistical reports, including transferring data, error-checking, and accessing assistance. For further help, contact Elementary SIS at (213) 241-4617. Learn more at UPDATE or the provided website.

E N D
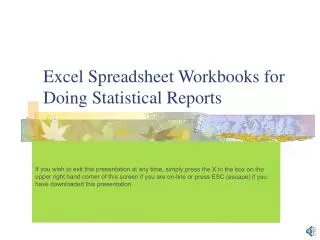
Excel Spreadsheet Workbooks for Doing Statistical Reports If you wish to exit this presentation at any time, simply press the X in the box on the upper right hand corner of this screen if you are on-line or press ESC (escape) if you have downloaded this presentation. PART II Customizing and using your workbooks
Your Excel Workbook or Workspace Customizing Your Excel Worksheets (213) 241-4617
Information is taken from the register to complete the Teacher Control Card
Understanding your Excel Workbook Each teacher is assigned a control card. Data is recorded from the register onto the yellow boxes matching the information on the register for the month. This is a view of the top half of the printed Teacher Control Card. On the top half there is a line for each monthly register page.
Excel Workbook Sections Data from the lower half of the register is transferred to the yellow boxes on the lower half of the Teacher Control Sheet / Card.
There are two grade span summary sheets. One is for months 1-5 and another is for months 6-10.
The Grade Span Yearly Summary Card contains all of the information necessary each month to complete the Elementary SIS Statistical Report.
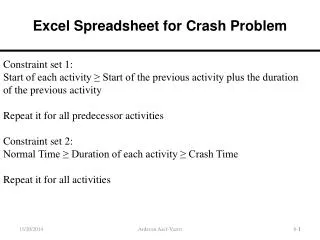
To avoid long searches for errors, check the PROOF figures for the month after completing EACH teacher page. (This will help you avoid searching through several teacher control cards for errors. – If it doesn’t prove, there is an error on the teacher control sheet you just completed. Once you have found and corrected the error, it will prove.)
This concludes the presentation on using and customizing the Excel spreadsheets to complete the Elementary SIS Statistical Report. • If you need information about statistical due dates or policy information, call the Attendance and Enrollment Section at (213) 241-2196. • If you need further assistance with customizing or using the downloaded statistical spreadsheet, call Elementary SIS at (213) 241-4617. • If you want to learn how to use spreadsheets or other software applications, call UPDATE at (213) 229-4836 or log onto http://www.lausd.k12.ca.us/lausd/offices/update/catalog.htm to sign up for classes. • PRESS the X in the upper right hand corner to exit this presentation if you are on-line or ESC (escape) if you have downloaded the presentation to your computer.