Download
1 / 34
340 likes | 443 Views
Popp József. Effects of the C rises on the P erspectives and E xport P ossibilities of the H ungarian A griculture. Solutions Through Cooperation Harkány 2009. 06. 23. Development of the CRB Food Index (1984 may – 2009 april). Escape of capital, high supply.

E N D
Popp József Effects of the Crises on the Perspectives and Export Possibilities of the Hungarian Agriculture Solutions Through Cooperation Harkány 2009. 06. 23.
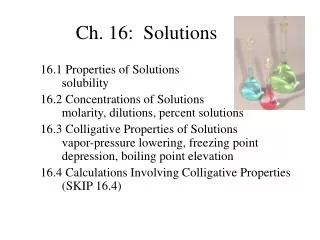
Development of the CRB Food Index (1984 may – 2009 april) Escape of capital, high supply Prices seceding from market funds Products: wheat (Kansas City, Minneapolis), sugar, cattle, pork,cocoa, corn, soya oil, butter, pork fat Source: CRB Reuters/Jefferies
Expected Development of real GDP on the middle run 7,5% 6,8% 4,5% 2,7-3,4% ? Source: World Bank, OECD-FAO
Incoming mail about GMO! Gazdasági növekedés Food Safety Challenges Eat more chicken • Growing population – growing demand for food • 1,2% yearly (growth rate 70-80 million person per year) • Growing incomes – growing demand for forage • Economic growth of Asia5-6%/year • Consumption of animal products (meat, milk) growing • Growing production of biofuels– growing demand • Competition for land (problem will return after recession) • Limited agricultural land • Expansion: Ukraine, Russia, South America • Buying/renting of agricultural land abroad • Technological development is determining • Is another “green development” necessary? • Will that be GMO? • Stimulation/subsidies are important • Climate change • Speculation • Is important for market liquidity • May increase price volatility Europe`s answer for the GMO:unnatural… but we ain`t producing food for the nature! Proof of climate change 18. cent.
Food and Energy Safety: Global Overview Till 2025 Low CO2emission Growing dependency World population: from 6,7 bln to 8 bln Demand of food grows Energy safety??? (will be important again with growing oil prices) Global food production has to increase by50% • Food • Forage • Bio materials (ex. biofuel) 2008 Grain: used for ethanol production 6% Sugarcane: for ethanol production 10% Oilplants: for biodiesel production 9% (vegetable oil)
Countries renting/buying agricultural land in other countries for food safety Countries renting/buying agricultural land thousand hectares Every square is for 50 thousand hectares. Where the bought/rented land is less, figures one square. Source: UNEP/GRID-ARENDAL
Growing Water Consumption • Till 2050 - 70-90% more foodstuff will be needed: growing food consumption and dietary changes. • Urbanization: domestic and industrial water consumption grows to double. • Climatic changes: extreme weather • Energy prices: water power plants, biofuel, desalination, fertilizers and chemicals Without increasing efficiency of water utilization the water consumption will grow to double in plant growing! Diet on Earth
Water utilization The „water bubble” is not sustainable any more: today 6,7 bln people are sharing the same quantity of water as 300 million global population in times of the Roman Empire. • Global evaporation of agricultural plants 7 100 km3/year: 7 100 000 000 000 000 liter • 78% of water utilized in food production comes from the rain. • Growing share of irrigation in water usage. Source: IWMI ([2007) In: Water for Food, Water for Life: A Comprehensive Assessment of Water Management in Agriculture, London: Earthscan, and Colombo: International Water Management Institute
Losses in the Food chain Producers Orts = tap left open Production losses Pests and diseases 20-40% Pre-processing Broken grain, mechanical damage 10-15% of quantity 25-50% of value (quality) Transport Pouring, leaking Stocking Insects, rodents, bacteria Processing/ Packaging Peeling, frittering, Marketing Retail 5-30% developed countries 2-20% developing countries Consumers/ Traders Orts Consumers Source: IWMI ([2007)
Answers and Challenges • Increasing productivity – Physical productivity of water – more yield/drop of water – Chemical productivity of water – more value/drop of water • Investment stimulation for increasing production in areas with natural fall and irrigation as well • Increasing water productivity– Technically possible, but farmers prefer to increase land productivity instead of water productivity mainly in areas where irrigation is being subvented. – What type of stimulation is necessary? • Stimulating trade of foodstuff between areas rich in water and areas with lack of water. • Decreasing losses in food chain Anyone who can solve the problems of water will be worthy of two Nobel Prizes – one for peace and one for science” (John F Kennedy)
Due to economic crisis not just demand, but also trust in partners has declined • Economic recession till 2010-2011 • Decreasing real income • Decreasing demand, changing structure of demand • Products with higher added value: • Cheaper substitutes: • Brands: • Devaluation of currencies, Exchange rate volatility • Restructuring of market positions • Lack of trust between market players and banks on domestic and international markets as well • Decreasing credit possibilities
Trade is the motor of economics, it`s oil is credit • Aggravation of credit terms • Size and owner structure of company • Brands and products of company • Partners and markets of company • Credit history, own capital • Leading well capitalized, multinational companies from developed countries will become stronger, while many small and middle-sized companies will bankrupt • Importers from risky countries can not obtain credit • Decreasing business possibilities (also for big companies) • Decreasing international trade volume $
Demand of agricultural products increasing again after temporary stagnation • Demand of basic foodstuff and biofuel is inflexible • Increasing demand on quantity and quality • Food industry getting into the spotlight again. The output of the sector in ten years has to be underlayed • Capital is already moving to countries where expansion of agricultural land is possible and obtains the resources. • Real value of the amounts spent on research and development in OECD region is decreasing. • The biggest problem today is the insufficient infrastructure and logistics – delivering the product to the market.
Immunity of agriculture to the crises is different in every country… • Public opinion: agriculture (especially plant growing excluding bioproduction) is less affected by the crises than other sectors • Countries where agricultural sector is barely affected: ex.: USA, Canada, UK etc. • Countries where agricultural sector is heavily affected: Pl. Brazil, Argentina, New Zealand, Denmark, Slovakia etc. • The main differences are in the way of financing the agricultural production and in the target markets.
100% Denmark 90% Germany Poland 80% Slovakia 70% Hungary 60% 50% Share of agricultural land 40% 30% 20% 10% 0% 0% 10% 20% 30% 40% 50% 60% 70% 80% 90% 100% Share of farms Average farm size in selected EU member states • GSzÖ (2007): 619,0 thousand farmers 7,4 thousand agricultural companies Private farms • 1 pork or 400 m2 vegetables/fruits Self-sufficient farms Source: KSH: Gazdaságszerkezeti összeírás: GSzÖ (2007), Eurostat(2007)
Average farm size in Hungary (2007 vs 2004) Half of the arable lend is cultivated by farmers, half by agricultural companies! • Producing farms (2 ESU<): 90 000 • IIER data (2008): 188 000 farms were entitled for direct subsidies • IIER data is not reflecting the real situation („sofa” farmers) • Slow concentration • Limited land market • 2%of the agricultural land subject of sale 1%- subject of inheritage yearly • Direct payments (whether based on production or not) are conserving the actual situation • Efficiency of revenue transfer is low: 38% of subsidies „seeping away” • 31% to land owners, 5% to others in the sector Source: Integrated Controlling and Management System Source: Disappearing direct payments, AKI (2008)
Foreign trade of hungarian food industry (2000-2008) Balance: 1,91 billion€ 6000 5000 Balance: 1,36 billion € 4000 million € 3000 2000 1000 0 2002 2003 2004 2005 2006 2007 2008 Export Import Source:KSH és AKI
Export of the Hungarian food industry by rate of processing (2000-2008) 7 000 6 000 5 000 1 774 1 474 4 000 million EUR 1 680 1 284 3 000 1 203 1 412 1 092 897 916 995 983 910 841 801 2 000 1 139 703 834 1 044 992 1 000 949 933 925 891 855 906 2 281 813 1 000 1 977 789 1 251 1 077 1 014 956 933 920 927 777 759 703 652 539 0 1 996 1 997 1 999 2 000 2 001 2 002 2003(régi) 2003(új) 2 004 2 005 2 006 2 007 2 008 1 998 Agricultural products Product of primary processing Product of secondary processing Source: KSH databaseand own calculation
Balance of the Hungarian food industry by rate of processing (2000-2008) 1 600 1 502 1 400 1 271 1 200 1 000 800 Million EUR 662 634 663 645 622 600 543 541 563 519 514 501 506 464 474 447 440 471 433 429 424 415 432 365 459 413 400 348 388 335 396 403 311 337 388 392 378 237 200 85 25 0 -32 -68 1 996 1 997 1 998 1 999 2 000 2 001 2 002 2003(régi) 2003(új) 2 004 2 005 2 006 2 007 2 008 -200 Agricultural products Products of primarz processing Products of secondary processing Source: KSH databaseand own calculation
Development of the foreign trade of foodstuff between Hungary and USA 1 000 USD Source: U.S. Department of Commerce és U.S. International Trade Commission.
Development of USD/HUF exchange rate Exchange rate is influencing foreign trade! Source: MNB
Structure of Hungarian foodstuff export (2007-2008) 1 000 USD Source: U.S.Department of Commerce és U.S. International Trade Commission.
Structure of Hungarian foodstuff import (2007-2008) 1 000 USD
Places where Hungarian foodstuff is entering the USA (2008) 1 000 USD Source: U.S.Department of Commerce és U.S. International Trade Commission.
Development of supply and demand of grain in selected new member states (2004/05-2007/08 average) Poland Romania Hungary ■Production■Domestic consumption■Export■Import Source:Eurostat
Share of livestock on the total output of agriculture Source: KSH
Transport costs of grain according to transport methods and direction 30 €/t (FOT-fco) /500 km 30-32 €/t (FOB-FOB) 30 €/t (FOT-fco) /500 km 22-24 €/t (FOB-FOB) 15 €/t (FOR-FOR) 15-20 €/t (FOB-CIF) Radius of competitiveness: 500 km on land, 1000 km on water! Source: AKI, IGC
Costs of sea transport to Spanish port (2008 October – 2009 May) Source: IGC
Problems of the Hungarian plant growing sector • Strong dependence on geographical distribution and seasonability of fall • Drought: lot of words, lack of deeds: in year 2008 there were 165 000 ha of agricultural land licensed by authorities for irrigation; in fact irrigated only 59 000 ha • Too small average size farms, legislative barriers • Decreasing usage of quality seeds • Temporary limitations of other inputs • Too high variety of wheat sorts (135), lack of big and homogenous shipments • Infection of fusaria (periodically and locally) • Continual decreasing of livestock (decreasing forage consumption) • Uncertainty of investors in the biofuel sector • Poor competitiveness of railway transport • Unpredictability of river transport because of water level • Domestic and international sales without documents (invoice) • Lack of reliability in keeping the contracts, lack of long-term contracts • Volatility of prices, lack of risk management • GMO regulation
Alternatives of diminishing the grain surplus Production of (bio)ethanol • European (and North American) ethanol price is depending mainly on Brazilian export price + customs tariff • Domestic capacities are poorly utilized (50%) • Realization of planned projects in Hungary is hindered by • Lack of will for signing long-term contracts and sharing of risk • Logistical conditions are not sufficient • Domestic market is saturated, pressure to sell abroad. EU and Hungary are net exportes of petrol and net importers of diesel • Growing share of diesel in fuel sales (ma 63%) Alternatives of diminishing the oil plant surplus Production of biodiesel • Price of biodiesel determined by German price • Leading companies in biodiesel production in Europe are Cargill, ADM and Bunge • These companies are integrating the production: who controls raw material, controls the market… • Interest of oil companies is to purchase standard quality biodiesel from a few big companies, MOL/ROSSI has own biodiesel production (purchasing plant oil)
Competitive disadvantages in the meat sector (general) • Genetics are ten years in front of the average applied technology • Meeting the environmental regulations – mainly in times of recession – is a great competitive disadvantage • Difficulties of credits: interest rates much too high (14-16%) • Black economy is holding up concentration • Prices of illegal meat sales are worsening the situation of legal meat producers • Increasing VAT is another stimulation for black economy • Costs of safeguarding are increasing (up to 0,5% of revenues) • Official dues are much too high (veterinary, meat checkup, etc.) • Fragmented structure of processing sector, out-of-date technology, low rate of capacity utilization (40-70%) • Low efficiency of labour • Parallel organizations • Boards, associations, etc. • Hungary has become a net importer in pork meat and milk products
Competitive disadvantages in the meat sector (special) Poultry • Low capacity of processing, presence of international investors is evanescent • Competitiveness of chicken meat is decreasing, export of ducks and gees still important Pork • Disorganized production sector (gilts often produced by growers) • Heterogenic genetic base, few growers, small stocks, small basis for selection • For pork growing is necessary to own/rent land (manure placing, forage growing) • Domestic buy-out prices following German and Holland prices • Exchange rate HUF/EUR is influencing the export and import:ex.: transport costs from Holland 45 HUF/kg (live weight) actually decreasing import (2008: 25 HUF/kg) Cattle • Significance of cattle breeding (with 50% of milk utilization) is decreasing, meat type cattle selling on abroad markets • Domestic demand is determining price stability (depending on market price and export markets) • Precondition of cattle breeding is own meadow and pasture and conscientious „stock management”
Competitive disadvantages in the Hungarian milk sector • Average content of fat and proteins is low in comparison with other member states • Lack of intensive meadow utilization, lack of low-cost pasturing, expensive intensive technologies • For milk production is necessary to own/rent land (manure placing, forage growing) • Owners of big dairy farms are old, they are selling the farms • Costs of safeguarding are increasing, official dues are much too high (veterinary, meat checkup, etc.) • Out-of-date technology in processing, low rate of capacity utilization • Smaller processors (producers of mass products) are getting into weaker position • Lack of will for rational division of labour between processors • Regional strength of processors could ensure some latitude against traders