Transport of Polycyclic Hydrocarbons and Microbial Community Dynamics in the Columbia River Estuary
130 likes | 238 Views
This study investigates the transport of polycyclic aromatic hydrocarbons (PAHs) with suspended particulate matter from the Columbia River to its estuary. It focuses on characterizing microbial community structure and gene expression in relation to environmental variables and salinity intrusion. The research entails sampling surface and bottom water to understand the role of the estuarine turbidity maximum (ETM) in trapping PAHs and the effects on microbial populations. Collaboration involves various marine scientists and technicians across multiple institutions.

Transport of Polycyclic Hydrocarbons and Microbial Community Dynamics in the Columbia River Estuary
E N D
Presentation Transcript
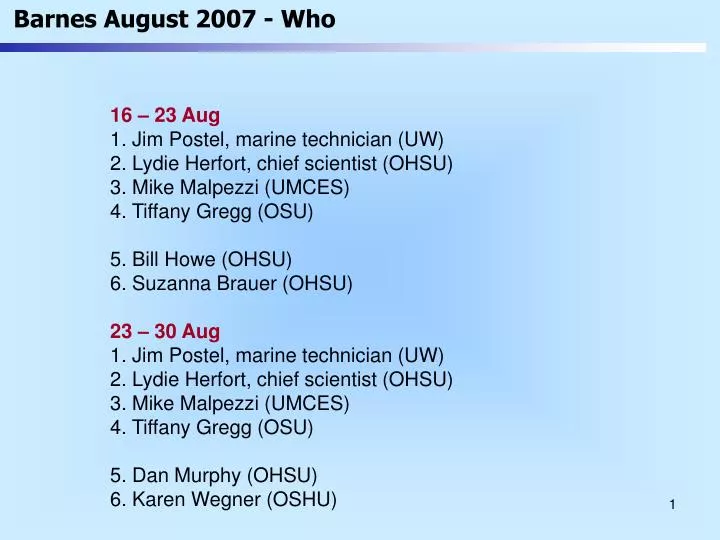
Barnes August 2007 - Who 16 – 23 Aug1. Jim Postel, marine technician (UW)2. Lydie Herfort, chief scientist (OHSU)3. Mike Malpezzi (UMCES)4. Tiffany Gregg (OSU)5. Bill Howe (OHSU)6. Suzanna Brauer (OHSU) 23 – 30 Aug1. Jim Postel, marine technician (UW)2. Lydie Herfort, chief scientist (OHSU)3. Mike Malpezzi (UMCES)4. Tiffany Gregg (OSU)5. Dan Murphy (OHSU)6. Karen Wegner (OSHU)
Barnes August 2007 - What Tiffany Gregg / Fred Prahl Transport of polycyclic hydrocarbons (PAHs) with suspended particulate matter from the Columbia River to its estuary(River & ETM)Lydie Herfort / Dan Murphy / Bill Howe / Mike Malpezzi / Karen Wegner/ Peter Zuber / Byron Crump/ Holly SimonMicrobial community structure & gene expression, environmental variables(River, ETM, limit salinity intrusion)Suzanna Brauer / Brad TeboCharacterising rates ofMn oxidation using 54-Mn & 14C-bicarbonate uptake(ETM) Samplingwater air pump (70L)sediment Shipeck grab
Plan for Barnes: where River ETM Neap tide Limit salinity intrusion ETM Spring tide
Locations of river end-member Aim: good river-end member 0 / 7 PSU 0 / 20 PSU Beaver Dock 0 PSU St Helen Confluent Willamette & Columbia Columbia Willamette Sampling surface & bottom water in estuary and surface in river
Plan for Barnes: where River ETM Neap tide Limit salinity intrusion ETM Spring tide
Tide in Astoria (17-29 Aug) and ETM sampling days Neap tide Spring tide S M N S M N S N • Aim: • Role of the ETM as a trap for PAHs • Discriminate particle-attached and free-living microbial communities and gene expression • Rate of Mn oxydation S = South Channel M = Mouth Channel N = North Channel = ETM sampling day Sampling surface & bottom water
Plan for Barnes: where River ETM Neap tide Limit salinity intrusion ETM Spring tide
Tide and limit of salinity intrusion sampling days N S • Aim: • Determine diffusion of microbial populations at the limit of salinity intrusion (0-5 PSU) S = South Channel N = North Channel = sampling day Sampling surface water
Samples to collect = 252 (X6 = total 1512 Sterivex) ETM, surface and Bottom water then separated into Bulk and Free-living bacteria S = surface water B = bottom water