Download
1 / 14
140 likes | 205 Views
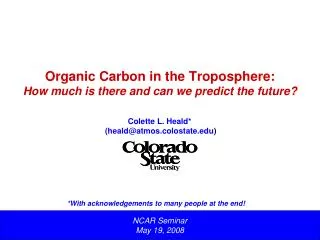
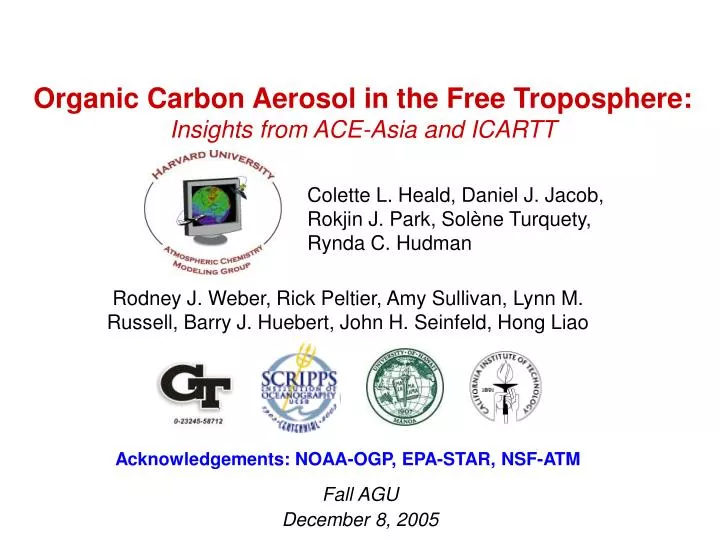
Organic Carbon Aerosol in the Free Troposphere: Insights from ACE-Asia and ICARTT. Colette L. Heald, Daniel J. Jacob, Rokjin J. Park, Sol è ne Turquety, Rynda C. Hudman. Rodney J. Weber, Rick Peltier, Amy Sullivan, Lynn M. Russell, Barry J. Huebert, John H. Seinfeld, Hong Liao. Fall AGU

E N D
Organic Carbon Aerosol in the Free Troposphere:Insights from ACE-Asia and ICARTT Colette L. Heald, Daniel J. Jacob, Rokjin J. Park, Solène Turquety, Rynda C. Hudman Rodney J. Weber, Rick Peltier, Amy Sullivan, Lynn M. Russell, Barry J. Huebert, John H. Seinfeld, Hong Liao Fall AGU December 8, 2005 Acknowledgements: NOAA-OGP, EPA-STAR, NSF-ATM
ORGANIC CARBON AEROSOL *Numbers from IPCC [2001] Secondary Organic Aerosol (SOA): 8-40 TgC/yr Reactive Organic Gases OC Nucleation or Condensation • Global Model Representation of SOA: • “Effective primary” yield • Two-product empirical fit to smog chamber data Oxidation by OH, O3, NO3 FF: 45-80 TgC/yr BB: 10-30 TgC/yr Monoterpenes Aromatics Direct Emission Fossil Fuel Biomass Burning BIOGENIC SOURCES ANTHROPOGENIC SOURCES
FIRST SUGGESTIONS OF HIGH ORGANIC CARBON AEROSOL CONCENTRATIONS IN THE FREE TROPOSPHERE High organic loading in the FT High organic loading in the UT TARFOX (E US) [Novakov et al., JGR, 1998] Single particles over NA [Murphy et al., Science, 1998]
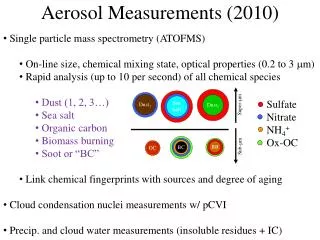
Mean Observations Mean Simulation (GEOS-Chem [Park et al., 2003]) Observations + ACE-ASIA: OC AEROSOL MEASUREMENTS IN THE FREE TROPOSPHERE (ACE-Asia aircraft campaign conducted off of Japan during April/May 2001) Seinfeld group Huebert group Russell group High Levels of OC were observed in the FT during ACE-Asia by 2 independent measurement techniques. We cannot simulate this OC with current models.
Mean Observations Mean Simulation (GEOS-Chem) ACE-ASIA: MODEL REPRODUCES OTHER AEROSOL PROFILES Secondary production Scavenging Scavenging GEOS-Chem simulates both the magnitude and shape of sulfate and EC concentrations throughout the troposphere what is different about OC?
ACE-ASIA: SECONDARY ORGANIC AEROSOL UNDERESTIMATED? SOA is a good candidate: condense more easily with colder temperature AND be produced in the FT (escape scavenging) Secondary Organic Aerosol Condensation of low vapour pressure ROGs on pre-existing aerosol GEOS-CHEM April Biogenic SOA Reactive Organic Gases [Chung and Seinfeld, 2002] mechanism Oxidation by OH, O3, NO3 Biogenic VOCs (eg. monoterpenes) FT observations ~ 4mg/m3 Simulated biogenic SOA far too small!
ICARTT: COORDINATED ATMOSPHERIC CHEMISTRY CAMPAIGN OVER EASTERN NORTH AMERICA AND NORTH ATLANTIC IN SUMMER 2004 • 2004 fire season in North America: • worst fire season on record in Alaska Multi-agency, International Collaboration MOPITT Observations of CO Transport (July 17-19) [Turquety et al., in prep] Emissions derived from MODIS hot spots [Turquety et al., in prep] OC: 1.4 TgC OC emissions from biomass burning were 4 times climatological average!
UNDERESTIMATE OF OC AEROSOL DURING ICARTT Observations GEOS-Chem Simulation OMC=organic molecular carbon (=1.4xOC) WS=water soluble (40-80% of total OC, primarily SOA) WSOMC NOAA ITCT-2K4 flight tracks (R. Weber’s PILS instrument aboard) SOA OMC (=POA+SOA) OC aerosol underestimate observed over North America as well. Note: biomass burning plumes were removed
EMISSIONS OF OC FROM BOREAL FIRES IN ALASKA/YUKON Fires over boreal regions generate enough energy to inject emissions into FT. Following Turquety et al. [in prep], we inject 60% of emissions directly into FT (3-5km) making these emissions a dominant source of OC in the FT. ITCT 2K4 OMC Observations (WS only) GEOS-Chem Simulation (with injected emiss) GEOS-Chem Simulation (with emission in BL) Injection of BB emissions into the FT increases the OC observed in the FT down-wind. However lack of correlation with CO in observations suggests that not all the OC can be attributed to the BB source.
INCLUDING ISOPRENE AS A SOURCE OF SOA Recent study: yield of SOA from isoprene is 0.9-3.0%[Kroll et al., 2005]. Isoprene oxidation products have been observed in the particulate phase [Claeys et al., 2004; Matsunaga et al., 2005] GEIA Emissions July/August 2004 10% yield = 0.8 Tg SOA 3% yield = 0.4 Tg SOA Applying smog chamber estimates [Kroll et al., 2005] to isoprene emissions inventories suggests a 50% increase in the SOA source over NA.
ISOPRENE SOA SOURCE: COMPARISON WITH OBSERVATIONS IMPROVE (July-August 2004) GEOS-Chem: 2-product SOA model ITCT-2K4 OMC POA: 0.73 SOA: 0.45 GEOS-Chem: 10%terp GEOS-Chem: 10%terp+3%isop Observations (WS only) GEOS-Chem (2-product SOA) GEOS-Chem (10% terp SOA) GEOS-Chem (10%terp + 3%isop SOA) POA: 0.73 SOA: 1.16 POA: 0.73 SOA: 0.75 Isoprene SOA sources improves agreement with IMPROVE surface observations (improves spatial correlation) particularly in the East
CLUES FROM CORRELATIONS WITH OTHER ICARTT SPECIES? BL (< 2km) FT (> 2km) Weak correlation with pollution In the FT Cloud-processing? [Lim et al., 2005] No correlation with photochemically- produced O3 In the FT Weak correlation with biogenic tracer in the FT No correlation with product of isoprene oxidation (Kroll et al. suggest MACR forms SOA) No correlation with aromatic SOA precursor Note: BB plumes removed
IS SCAVENGING OF OC AEROSOLS OVERESTIMATED IN MODELS? Hydrophillic aerosols are wet scavenged assuming 100% solubility. Recent analysis of cloud events at Puy de Dome suggest scavenging efficiency of OC may be much lower [Sellegri et al., 2003]. Observations GEOS-Chem Simulation GEOS-Chem Simulation (with scavenging e=0.14) ITCT 2K4 OMC A large decrease in scavenging efficiency increases OMC concentrations throughout the troposphere. To what degree are OC aerosols internally mixed?
ORGANIC CARBON IN THE FT: AN ONGOING QUESTION • Chemistry leading to SOA production is not well understood! • (And not represented in global models) • BUT field observations can provide insights. • Conclusions: • The large underestimate in OC aerosol concentrations observed during ACE-Asia cannot be explained by an underestimate in primary emissions • High OC concentrations in the FT observed during ICARTT can be partially explained by injection of aerosols from boreal fires in Alaska. • Including direct production of SOA from isoprene improves the correlation with surface observations during ICARTT. • OC concentrations in the FT are sensitive to efficiency of wet loss processes. How internally mixed are OC aerosols? • Many, many processes are not included in global models (SOA formation in clouds, polymerization reactions, heterogeneous reactions, etc.). To what degree can models represent OC aerosol concentrations (and the important biosphere-atmosphere feedbacks) using simple parameterizations?