Enhancing Label-Free Quantification of Plasma Proteins with High-Resolution Mass Spectrometry
This study explores improvements in label-free mass spectrometry for the quantification of plasma and serum proteins, using a novel real-time intelligent acquisition strategy paired with high-resolution mass spectrometry. We compare MS1 and MS2-based methods within complex plasma matrices, highlighting the advantages of our approach in achieving higher accuracy in peptide identification and quantification. Through the development of a local spectral library, we demonstrate how this method facilitates efficient data acquisition and enhances biomarker discovery workflows.

Enhancing Label-Free Quantification of Plasma Proteins with High-Resolution Mass Spectrometry
E N D
Presentation Transcript
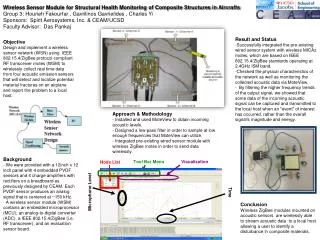
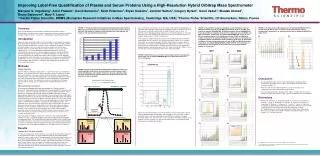
Improving Label-Free Quantification of Plasma and Serum Proteins Using a High-Resolution Hybrid Orbitrap Mass Spectrometer Maryann S. Vogelsang1, Amol Prakash1, David Sarracino1, Scott Peterman1, Bryan Krastins1, Jennifer Sutton1, Gregory Byram1, Gouri Vadali1, Shadab Ahmad1, Bruno Darbouret2, Mary F. Lopez11Thermo Fisher Scientific, BRIMS (Biomarker Research Initiatives in Mass Spectrometry), Cambridge, MA, USA; 2Thermo Fisher Scientific, CD Biomarkers, Nimes, France Overview Assessing the differences between MS1- and MS2-based label-free relative quantification in a complex plasma matrix using a novel real-time, intelligent acquisition strategy for high-resolution, accurate-mass (HR/AM) global targeted quantification. Introduction Label-free mass spectrometry (MS) is an increasingly preferred method for biomarker discovery workflows applied to serum and plasma samples. Given the right conditions, label-free relative quantification is cleaner, simpler, and higher throughput. Resulting differential analysis from these label-free discovery experiments often leads to targeted analyses for verification. High resolution and mass accuracy are critical components to successfully identifying and quantifying peptides in a label-free experiment. Here we present a real-time intelligent acquisition strategy for HR/AM targeted quantification and compare it to relative quantification from MS1 full scan spectra, and introduce a strategy that enables higher confidence in both qualitative and quantitative results in the label-free discovery runs. We propose using HR/AM MS and MS/MS schemes in conjunction with validated spectral libraries for automated method building, data acquisition, verification, and quantification in real-time using novel acquisition schemes. Methods Sample Preparation A protein mixture consisting of eight proteins — cytochrome c (horse), α-lactalbumin(bovine), serum albumin (bovine), carbonic anhydrase(bovine), ovalbumin (chicken), α-S1-casein (bovine), α-S2-casein (bovine), β-casein (bovine) — was prepared at equimolar ratios. The eight non-human proteins were analyzed at 100 fmol on column in a “neat” background as well as 100 fmol on column spiked into a human plasma matrix of 1ug on column. The eight proteins were also investigated in the human plasma matrix at varying amounts ranging from 0.5 to 500 fmol each protein on column. MS Data Acquisition and Analysis All samples were digested with trypsin and analyzed on a Thermo Scientific™ Q Exactive™ mass spectrometer equipped with a Thermo Scientific™ Nanospray Flex Ion Source . Data was acquired in two steps to simulate traditional workflows. Initial experiments employed unbiased data-dependent MS/MS acquisition resulting in peptide/protein identification as well as building of a spectral library. These initial data-dependent runs were run on both the “neat” conditions of the eight protein mix (without the plasma matrix), and then on a 100 fmol level (each protein) on column in a plasma matrix of (1 µg plasma on column). These initial data-dependent runs were searched against a modified human database containing the eight additional proteins. The combined results from the discovery experiments were used to build a local spectral library consisting of precursor and product ion m/z values and relative abundance distribution as well as relative retention time values. A highly multiplexed, targeted protein list was created from the spectral library and used for automated data acquisition and processing real-time to facilitate changes to the acquisition scheme. For full description of acquisition method and scheme, please visit poster 131 on Tuesday, by Prakash et. al.1 Thermo Scientific™ Proteome Discoverer™ version 1.3 and Thermo Scientific™ Pinpoint™ version 1.3 software packages were used to analyze both the qualitative and quantitative data. The spectral library resulting from initial runs was used to create a targeted inclusion list and reference information to perform qual/quan determination in real time. Data were acquired and peptide coverage and relative quantification were measured for each of the eight standard proteins. All samples were run in triplicate. Results Intelligent Real-Time Data Acquisition The discovery experiments were performed in an unbiased data-dependent acquisition for the eight protein mixtures in “neat” conditions as well as in a complex plasma matrix. From these initial results, 170 target peptides from the eight proteins were used to build the spectral database, Figure 1. These 170 targets were built into a spectral library look-up table that was used in real-time state modeled acquisition. The look-up table includes the precursor m/z values for the defined charge state as well as the expected retention time window, which are used to initiate product ion spectral acquisition based on the presence of multiple precursor isotopes during the expected elution window (Figure 2). Our current MS-based biomarker discovery studies employ label-free quantification of proteomic data using MS1 extracted ion chromatograms (XIC). In our typical discovery experiments, we get MS1 quantification at signal threshold levels as low as 1e5. However, when employing powerful software such as Pinpoint software, we can verify that some of the MS1 quantification may be false positives (demonstrated by loss of multiple isotope peaks or isobaric contaminants). In this study, we compare the novel real-time state modeled acquisition based MS2 quantification with full scan MS1 (XIC) based quantification (Figure 3). As a general observation, we see that the quality of the MS1 quantification for peptides above 2 femtomoles, the number of targeted peptides we quantify with confidence, is on-par with the MS2-based quantification. However, below 2 femtomoles, the quantity and quality of peptides quantified based on MS1 XIC, drops to nearly 50% of MS2. There is 25–50% false positive quantification at the 0.5–1 fmol level peptides. FIGURE 4. Peak profiles for peptides identified at each femtomolar level, for MS1 quantification (A, C, E) and for MS2 quantification (B, D, F). (A) MS1 peak profiles for peptide VGDANPALQK. (B) MS2 peak profile view of VGDANPALQK. Insets (A) and (B) are expanded views of 0.5 to 2 fmol level. (C) and (D) MS1 and MS2 peak profiles, respectively, for peptide LGEYGFQNALIVR. Insets (C) and (D) are expanded views of 0.5 to 2 fmol level. (E) and (F) MS1 and MS2 peak profiles, respectively, for peptide FALPQYLK. Inset (E) shows an expanded view of probable isobaric contamination from neighboring peak. Inset (F) shows MS2 confidence, 10 fmol level quantification. (G) and (H) MS1 and MS2 peak profiles, respectively, for peptide DM[Oxid]PIQAFLLYQEPVLGPVR. Inset (H) shows an expanded view of peak profile for the product ions for the representative peptide at 10 fmol level. FIGURE 5. (A) False positive MS1 peak profiles for peptide DLGEEHFK at 0.5 to 10 fmol level. (B) XIC for 487.733 isotopes, illustrating probable isobaric contaminants; (arrow) points to observed elution time for peptide DLGEEHFK at higher levels. FIGURE 1. Histogram showing the number of targeted peptides with confident MS2 peak area quantification per femtomolar level of protein mixture. The bars represent the number of confident areas quantified out of the potential 170 targets on the spectral library look-up table. A B Most intense isotope 2nd most intense isotope Start time for “watch list” Stop time for “watch list” MS1 MS2 1. A B FIGURE 3. MS2 Peak area as a function of mass load and their corresponding variance per run for peptide VGDANPALQK. Inset: Expanded view of the0.5 to 10 fmol level. Measured Ion Intensity FIGURE 2. Pictorial representation of high IQ data acquisition schemes for targeted peptide quantification using a targeted scanning window, target elution identification, and real-time product ion spectral acquisition. Both precursor and product ion spectral matching is performed to increase the selectivity of data acquisition. Triggering Threshold C D • Conclusion • The development of the real-time state modeled data acquisition provides quantification of peptide species at lower concentrations and lower signal thresholds (below 1 e4). • Real-time state modeled data acquisition results in at least 50% more identifications than MS1 quantification below 10 fmol. • This novel data acquisition scheme provides higher sensitivity and selectivity of peptides in a label-free complex matrix – ideal for a biomarker discovery workflow. • References • Prakash, A.; Peterman, S.; Frewen, B.; Kuehn, A.; Ciccimaro, G.; Schroeder, T.; Vasicek, L.; Hood, B.; Bomgarden, R.; Krastins, B.; Sarracino, D.; Byram, G.; Vogelsang, M.; Worboys, J.; Jorgensen, C.; Conrads, T.; Lopez, M. Improving throughput for highly multiplexed targeted quantification methods using novel API-remote instrument control and state-model data acquisition schemes. 61st ASMS Conference on Mass Spectrometry and Allied Topics, Minneapolis, MN, June 9–13, 2013. Poster TP08 – Peptides: Quantitative Analysis I, poster number: 131, Tuesday, Halls B&C. Retention Time (min) Experimental HR/AM MS Spectrum Experimental Spectrum * * Theoretical Isotope Spectral Library E F VGDANPALQK Figures 4 and 5 demonstrate the increased confidence that is attained with real-time state-modeled MS2 data quantification. The advantage of this acquisition scheme is evident at levels of proteins and peptides below 10 fmol on column (or at signal thresholds below 1 e4). There are cases in our study where both MS1 and MS2 do not quantify a species; however, it is important to note that there are significantly fewer false-positives with MS2 quantification. G H 10 fmol All trademarks are the property of Thermo Fisher Scientific and its subsidiaries. This information is not intended to encourage use of these products in any manners that might infringe the intellectual property rights of others.