Position-Time Graphs Velocity-Time Graphs
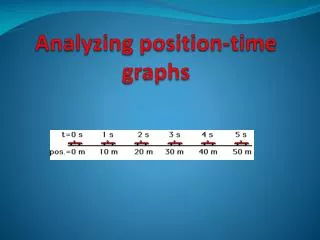
Position-Time Graphs Velocity-Time Graphs. Using graphs to describe motion. The line. To begin, consider a car moving with a constant, rightward (+) velocity. Calculate the velocity of the car in the diagram below. (v = d / t) v= 10m/s. The Graph. A review: Axis The variables


Position-Time Graphs Velocity-Time Graphs
E N D
Presentation Transcript
Position-Time GraphsVelocity-Time Graphs Using graphs to describe motion
The line • To begin, consider a car moving with a constant, rightward (+) velocity. • Calculate the velocity of the car in the diagram below. (v = d / t) • v= 10m/s
The Graph • A review: • Axis • The variables • Point of Origin
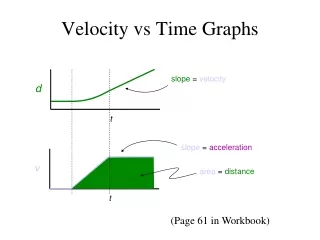
The Slope of a P/T graph • What does the slope signify? • Slope = velocity • What is the slope of this line?
What is going on here? • What would happen if I had a horizontal line, what does that mean? • What about a vertical line, what would that mean?
You should be able to do: • The object is changing its position in the north direction from 0 to 3 seconds, the velocity is uniform. • The object stays at the same position for about 3 seconds - its stopped for 3 seconds. • From the 6th to the 8th second the object is backtracking, its returning to the starting position ( our reference point ). • From the 8th second on the object passes the starting position and travels southward from it.
Acceleration • Consider a car moving with a constant, rightward (+) velocity of +10 m/s. • A car moving with a constant velocity is a car moving with zero acceleration
Velocity-Time Graph • What can you tell me about this graph? • What does the slope of this graph represent?
Acceleration cont. • Since the graph is a velocity-time graph, the velocity is positive whenever the line lies in the positive region • Similarly, the velocity is negative whenever the line lies in the negative region • a positive velocity means the object is moving in the positive direction; and a negative velocity means the object is moving in the negative direction. • So if an object is moving in the positive direction, the line is located in the positive region of the velocity-time graph (regardless if it is sloping up or sloping down).
Acceleration cont. • Finally, if a line crosses the x-axis from the positive region to the negative region of the graph (or vice versa), then the object has changed directions.
Example of a difficult v-t Graph • Our data is captured when the object is already moving, it has a constant velocity of 30m/s [N] up to the 3rd second of observation. • The object decelerates, reaches no velocity and then begins traveling in the south direction. • The object travels at a constant velocity south for 3 seconds • The object smoothly decelerates and comes to a stop