Download
1 / 17
170 likes | 360 Views
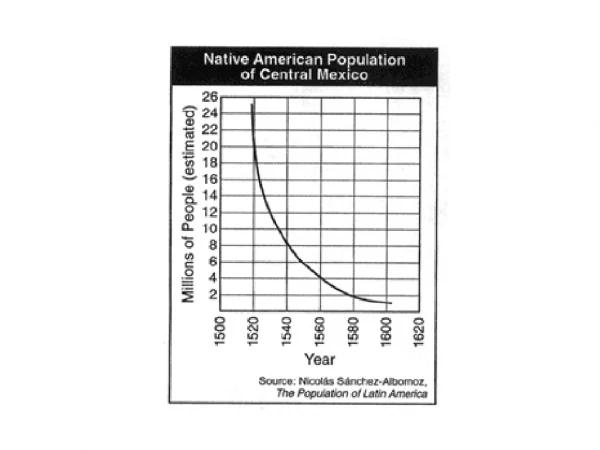
Between 1540 and 1580, what happened to the native population of Central Mexico? It decreased by approximately 6 million people. It increased to a high of 26 million people. It increased by approximately 2 million people per year. It decreased to 8 million people.

E N D
Between 1540 and 1580, what happened to the native population of Central Mexico? It decreased by approximately 6 million people. It increased to a high of 26 million people. It increased by approximately 2 million people per year. It decreased to 8 million people.
The principal cause of the trend in England shown in the graph was (1) famine (2) immigration (3) disease (4) a lower birthrate
Which statement is best supported by the data in the graph? The urban areas of Honduras and Panama require the largest supply of water in Central America. Belize and Costa Rica are meeting the water needs of their urban population. Urban water supplies are declining in many Central American countries. Most Central American countries experienced a decrease in urban population between 1980 and 1988.
Which action will help slow the trend indicated by the graph? expanding Green Revolution technology increasing industrialization in developing nations using alternative energy sources lowering worldwide oil prices
Which conclusion can be drawn from the information in the chart? Developing countries are instituting programs to limit the growth of their populations. Infant mortality is a greater problem in Africa than in Asia. The nations with relatively low birthrates have relatively high per capita incomes. The national birthrate is determined by many different factors.
Between 1960 and 1987, a major effect of the Green Revolution on India was a decrease in the production of grain after 1975 an increase in grain imports after 1984 steady decrease in grain imports from 1960 to 1966 an overall increase in the production of grain since 1966
Which conclusion about the population of China between 2000 and 2025 can be drawn from the information provided by this chart? The fertility rate of Chinese women is expected to increase. (2) Chinese life expectancy will likely decrease. (3) The rate of population growth is expected to decline. (4) By 2025, the birthrate in China will probably double.
The graph shows that between 1950 and 2000 the world’s population increased by approximately 1 billion (2) 4 billion (3) 6 billion (4) 8 billion


