Download
1 / 10
100 likes | 288 Views
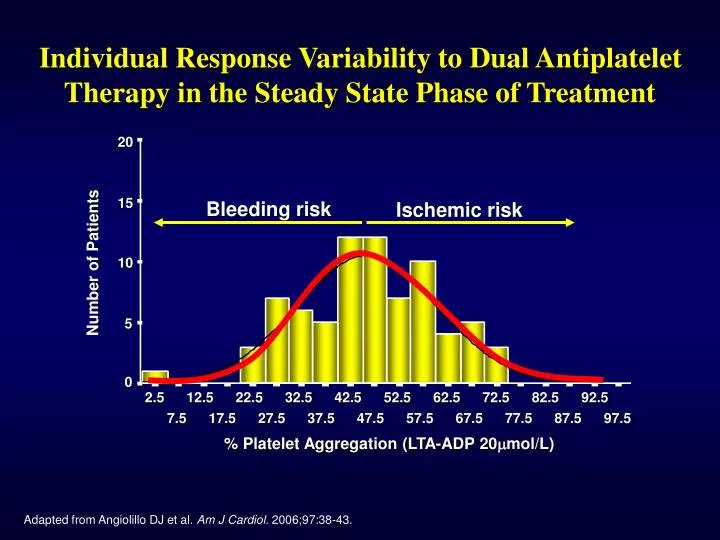
Individual Response Variability to Dual Antiplatelet Therapy in the Steady State Phase of Treatment. 20. Bleeding risk. Ischemic risk. 15. Number of Patients. 10. 5. 0. 2.5. 12.5. 22.5. 32.5. 42.5. 52.5. 62.5. 72.5. 82.5. 92.5. 7.5. 17.5. 27.5. 37.5. 47.5. 57.5. 67.5.

E N D
Individual Response Variability to Dual Antiplatelet Therapy in the Steady State Phase of Treatment 20 Bleeding risk Ischemic risk 15 Number of Patients 10 5 0 2.5 12.5 22.5 32.5 42.5 52.5 62.5 72.5 82.5 92.5 7.5 17.5 27.5 37.5 47.5 57.5 67.5 77.5 87.5 97.5 % Platelet Aggregation (LTA-ADP 20mmol/L) Adapted from Angiolillo DJ et al. Am J Cardiol. 2006;97:38-43.
Clinical Relevance of Clopidogrel Non-responsiveness Stent Thrombosis Angiolillo DJ et al. Am J Cardiov Drugs. 2007.
Clinical Relevance of Clopidogrel Non-responsiveness Post-Stent Ischemic Events and Periprocedural Infarction Angiolillo DJ et al. Am J Cardiov Drugs. 2007.
Genetic Factors • Polymorphisms of CYP • Polymorphisms of GPIa • Polymorphisms of P2Y12 • Polymorphisms of GPIIIa Clopidogrel Response Variability • Cellular Factors • Accelerated platelet turnover • Reduced CYP3A metabolic activity • Increased ADP exposure • Up-regulation of the P2Y12 pathway • Up-regulation of the P2Y1 pathway • Up-regulation of P2Y–independent pathways • (collagen, epinephrine, TXA2, thrombin) • Clinical Factors • Failure to prescribe/poor compliance • Under-dosing • Poor absorption • Drug-drug interactions involving CYP3A4 • Acute coronary syndrome • Diabetes mellitus/insulin resistance • Elevated body mass index Angiolillo DJ et al. J Am Coll Cardiol. 2007; 49: 1505-1516 .
Influence of Diabetes Mellitus on Clopidogrel-induced Antiplatelet Effects Acute phase of treatment Long-term phase of treatment 80 DM No-DM P=0.001 P<0.0001 8% P=0.04 60 14% 38% 56% Platelet aggregation (%) 78% 6% 40 24 hrs post 300 mg LD 20 Non-responders (Platelet inhibition 10%) Low responders (Platelet inhibition 10-29%) Responders (Platelet inhibition >30%) 0 T2DM No-DM T2DM No-DM ADP 20 mol/L ADP 6 mol/L Angiolillo DJ et al. Diabetes. 2005;54:2430-5. Angiolillo DJ et al. J Am Coll Cardiol 2006;48 298-304.
Platelet Function According to Hypoglycemic Treatment ADP 6 µmol/L ADP 20 µmol/L 80 P<0.0001 70 P<0.0001 60 50 % Platelet aggregation (LTA) 40 30 20 10 0 NDM NIDDM IDDM NDM NIDDM IDDM Angiolillo DJ et al. J Am Coll Cardiol. 2006;48:298-304.
150 mg clopidogrel/day for 30 days (n=20) 75 mg clopidogrel/day for 30 days (n=20) OPTIMUS Study: (Optimizinganti-Platelet Therapy In diabetes MellitUS) Type 2 diabetes mellitus patients with coronary artery disease on aspirin (81 mg) + clopidogrel (75 mg) therapy for ≥1 month Inclusion Criteria Platelet function assessment to identify suboptimal and optimal responders Study Time Point 1 Optimal responders Suboptimal responders * Randomization Not eligible for randomization Study Time Point 2 Platelet function assessment 75 mg clopidogrel/day for 30 days Study Time Point 3 Platelet function assessment Angiolillo DJ et al. Circulation. 2007;115:708-16. * >50% ADP (20 mmol/L)-induced post-treatment platelet reactivity
P=0.002 P<0.0001 P=0.32 P=0.5 63.1±7 52.3±13 OPTIMUS Study: (Optimizinganti-Platelet Therapy In diabetes MellitUS) Primary Endpoint: Maximal ADP (20 mmol/L) Platelet Aggregation 100 64.9±9 67.4±6 80 60 Maximal ADP (20 mmol/L) platelet aggregation (%) 40 20 0 T1 T1 T2 T2 75mg 150mg Angiolillo DJ et al. Circulation. 2007;115:708-16.
100% 40% 60% OPTIMUS Prevalence of Patients Reaching Therapeutic P2Y12 Target Levels (20 mmol/L-induced Aggmax≤50%) Aggmax >50% Aggmax≤50% 100 80 60 % 40 20 0 75 mg 150 mg Angiolillo DJ et al. Circulation. 2007;115:708-16.
Novel P2Y12 ADP Receptor Antagonist More potent and less variability!! Angiolillo DJ et al. J Am Coll Cardiol. 2007; 49: 1505-1516 .