Download
1 / 21
210 likes | 370 Views
Sources of Hepatitis C Infection (U.S.). Newly Acquired (1995-2000). Previously Acquired (<1990s). Injection Drug Use 60%. Injection Drug Use 68%. Sexual 15%. Transfusion 10%. Unknown 9%. Sexual 18%. Unknown 10%. Other 1%*. Other 1%*. Occupational 4%. Occupational 4%.

E N D
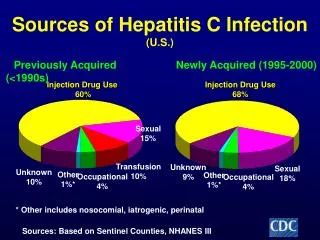
Sources of Hepatitis C Infection(U.S.) Newly Acquired (1995-2000) Previously Acquired (<1990s) Injection Drug Use 60% Injection Drug Use 68% Sexual 15% Transfusion 10% Unknown 9% Sexual 18% Unknown 10% Other 1%* Other 1%* Occupational 4% Occupational 4% * Other includes nosocomial, iatrogenic, perinatal Sources: Based on Sentinel Counties, NHANES III
Differences in Risk Behaviors for HCV Acquisition in IDUers Young IDUers(< 30 yrs) in San Francisco % N=584 males N=260 females Evans J, J Urban Health, 2003
Predictors of Unsafe Syringe Sharing in Women IDUers * Adjusted odds ratios Tortu S, AIDS and Behavior, 2003
Risk of HCV Transmission Between Sex Partners Thomas D, JID, 1995
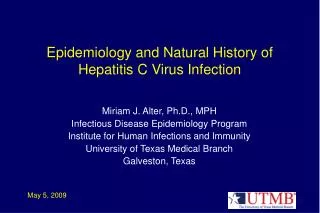
Natural History of HCV InfectionLiver Disease Progression Exposure (Acute Phase) 15-45% 55-85% Chronic Resolved 5%-25% over 20 years 75-95% Stable Cirrhosis 5% per year 3% per year HCC Decompensation Liver Failure Alter MJ. Semin Liver Dis. 1995 Freeman, Hepatology 2001
Rate of Spontaneous Clearance of HCV Following Exposure • 704 Irish women infected with HCV by contaminated anti-D immune globulin were tested for HCV 17 years after exposure --> 55% HCV RNA+ • Liver biopsies performed in 363 patients % • Kenny-Walsh et al, N Engl J Med 1999
Chronic HCV Infection with Persistently Normal ALT Levels • Accounts for ~30% of persons with chronic HCV infection • Histological disease tends to be mild • Cirrhosis present in 2.5% (X-sectional studies) • Rate of disease progression is slower than patients with abnormal ALT levels • Same genotype distribution and viral load as abnormal ALT • Female gender predominates -> 61-90% of the normal ALT population
Risk Factors for Progressive Fibrosis and Cirrhosis • Persistently elevated ALT levels • Longer duration of infection • Alcohol excess (>50 gm/day) • Age >40 years at time of infection • HIV or HBV coinfection • High BMI • Male gender Poynard T, Lancet 1997 349:825-32 Mathurin P, Hepatology 1998 27:868-72 Benhamou J, Hepatology 1999 30:1054-8
Cirrhosis 4 Bridging Fibrosis 3 Portal Fibrosis + Septae 2 Portal Fibrosis 1 No Fibrosis 0 Rate of Fibrosis ProgressionBy Gender Males Females 1 2 3 4 5 Duration of Infection (yrs) Poynard, Lancet, 1997
≥50 g alcohol/day ≥50 g alcohol/day 0-49 g alcohol/day 0-49 g alcohol/day Fibrosis and Alcohol Consumption 4 4 Fibrosis Stage Fibrosis Stage 1 1 20 30 40 50 60 10 20 30 40 50 Duration of Infection (Years) Age of Biopsy (Years) Poynard T et al, Lancet 1997
Risk of Cirrhosis in Alcohol and HCV 1 6 0 HCV negative 1 4 0 HCV positive 1 2 0 1 0 0 8 0 6 0 4 0 2 0 0 0 2 5 - 5 0 7 5 - 1 0 0 1 2 5 - 1 5 0 > 1 7 5 gms Lifetime Daily Alcohol Intake 12 gms = 1 drink Corrao and Arico, Hepatology 1998;27:917.
Alcohol is an important cofactor in HCV disease progression With ingestion of equivalent amounts of alcohol, females are at higher risk of alcohol-related liver injury than males Women with HCV who drink alcohol may be at higher risk of progressive liver disease than male who drink
Alcoholic Cirrhosis Alcoholic Liver Disease 20 18 16 14 12 10 8 6 4 2 0 20 18 16 14 12 10 8 6 4 2 0 Men Women Estimated relative risk Estimated relative risk Men Women <1 1-6 7-13 14-27 28-41 42-69 >70 <1 1-6 7-13 14-27 28-41 42-69 >70 Beverages per week Beverages per week Becker U, et al. Hepatology 1996 1 beverage = 12 g/alcohol
Alcohol Consumption and Risk of Chronic Liver Disease • Odds of developing CLD and cirrhosis are increased in women consuming 1 or more drinks per day (≥13 g/day) • Dose-response is present --> More alcohol means higher risk of developing cirrhosis • In setting of chronic HCV infection, the “safe” level of alcohol is unknown but predicted to be less than that for alcoholic liver disease • Risk of cirrhosis increased significantly by ingestion of >50/gm day alcohol (but gender specific data lacking)
Chronic HCV Infection and Hepatocellular Carcinoma (HCC) • Age-adjusted incidence of HCC increasing in the U.S. • Doubling in past 2 decades (1975 -1998) • 3.0/100,000 persons in 1996-1998 • Incidence is expected to risk further as number of prevalent HCV cases with cirrhosis and other complications of long-standing disease increases • Ethnic, geographic and gender differences are evident • In all ethnic groups, men have twice the rate of HCC as females
Reproductive Status and HCC Risk in Women with CVH 218 women HCC (majority infected with HBV or HCV), 719 controls Yu MW, Hepatology, 2003
Summary Gender Differences in the Natural History of HCV Disease • Rate of spontaneous clearance of virus following exposure is high in (young) women • Among persons with chronic HCV infection and persistently normal liver enzymes, the majority are women • Severity of disease is less and rate of disease progression slower in women than men • Alcohol use by women with HCV is likely to have more pronounced effects on the liver than men • Rates of HCC are lower in women than men and reproductive factors may influence HCC risk.
Summary of Advances in Antiviral Therapy 55-56% 60% 38-45% 40% % Patients 20% 13-19% 0% IFN 48 wks IFN -2b + RBV PEG-IFN + RBV McHutchison JG. Semin Liver Dis. 1999; Manns M, Lancet 2001; Fried M, N Engl J Med 2002
Treatment Factors • Target RBV dose • Treatment Duration • Adherence to full dose therapy Predictors of Virologic Response Host Factors Viral Factors • Age • Cirrhosis • Race • Gender • Weight • Genotype • Viral Load
Factors Influencing Response to Interferon Plus Ribavirin Genotype 2 or 3 Genotype 1 Minimal fibrosis Advanced fibrosis Low HCV RNA High HCV RNA Age 40 Age > 40 Female Increasing usefulnessin predictingviral clearance with Rx Male Weight 75 kg Weight > 75 kg 20 40 60 80 Sustained Virologic Response (%) Adapted from McHutchison JG et al. Semin Liver Dis. 1999;19(suppl 1):63.
Baseline Factors Independently Associated with SVR 180 160 N= 1737 PEG IFN Alfa-2a + RBV 140 Wald Chi-Square 120 100 80 60 40 20 0 Age Race Weight Gender Histology ALT Quotient US vs Non US Genotype (1 vs non-1) 24 vs 48 Wks Tx Pretreatment Viral Load 800 vs 1000/1200 mg RBV FDA Antiviral Drugs Advisory Committee Proceedings Peginterferon alfa-2a. November 14, 2002.