Download
1 / 25
250 likes | 352 Views
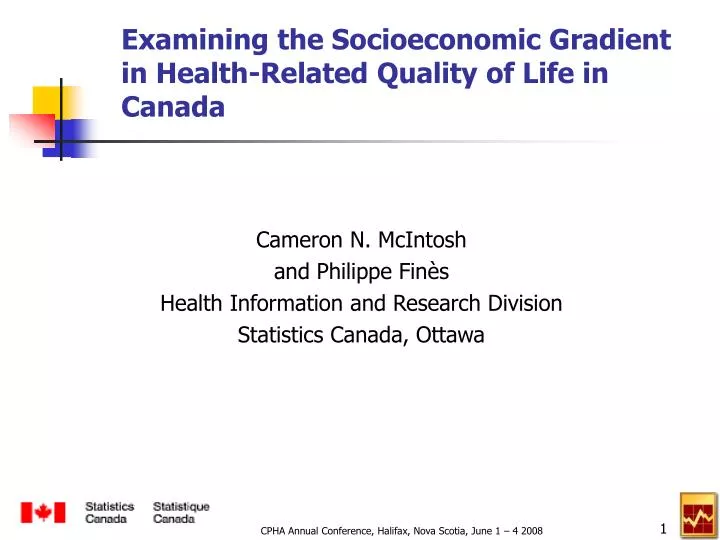
Examining the Socioeconomic Gradient in Health-Related Quality of Life in Canada. Cameron N. McIntosh and Philippe Fin è s Health Information and Research Division Statistics Canada, Ottawa. Context and Background.

E N D
Examining the Socioeconomic Gradient in Health-Related Quality of Life in Canada Cameron N. McIntosh and Philippe Finès Health Information and Research Division Statistics Canada, Ottawa CPHA Annual Conference, Halifax, Nova Scotia, June 1 – 4 2008
Context and Background • Despite the fundamental principle of “health for all”, socioeconomic disparities in health persist in Canada (e.g., Choinière, Lafontaine, & Edwards, 2000; Raphael, 2000; Wilkins, Tjepkema, Choinière, & Mustard, forthcoming) • Many health indicators exhibit a socioeconomic gradient: • Overall/cause-specific mortality • Risk factors • Incidence/prevalence rates for chronic disease • Self-perceived health CPHA Annual Conference, Halifax, Nova Scotia, June 1 – 4 2008
Health-Related Quality of Life • “The value attached to the duration of life as modified by the impairments, functional states, perceptions, and social opportunities that are influenced by disease, injury, treatment or policy” (Patrick & Erickson, 1993) CPHA Annual Conference, Halifax, Nova Scotia, June 1 – 4 2008
Rationale • Overall socioeconomic disparities in health-related quality of life well studied at the national level in Canada (e.g., Eng & Feeny, 2007) • Condition-specific disparities mainly studied sub-nationally, using small clinical samples (e.g., Marra et al., 2004) CPHA Annual Conference, Halifax, Nova Scotia, June 1 – 4 2008
Objectives • Quantify differences in health-related quality of life between socioeconomic strata, both generally and for specific health conditions in a representative sample of the household population • Identify areas where interventions directed at reducing disparities might produce the greatest health benefits CPHA Annual Conference, Halifax, Nova Scotia, June 1 – 4 2008
Data Source • 2000-2001 Canadian Community Health Survey (CCHS) • Cross-sectional survey that collects information on health status, health determinants, and health care utilization • representative of the Canadian household population aged 12 and over • 131,535 person records in cycle 1.1 • Only cycle with HUI3 administered to all respondents CPHA Annual Conference, Halifax, Nova Scotia, June 1 – 4 2008
Analysis Variables • Income adequacy: • respondents’ best estimates of total household income divided by adjusted household size, and then partitioned into deciles • Educational attainment: • Less than high school • High school graduation, including trades qualification • Post-secondary certificate or diploma • University degree (BA or higher) CPHA Annual Conference, Halifax, Nova Scotia, June 1 – 4 2008
Analysis Variables • Selected Chronic Conditions • “Conditions that have lasted or are expected to last six months or more and have been diagnosed by a health professional.” • Four high impact conditions: cancer, heart disease, diabetes, and arthritis CPHA Annual Conference, Halifax, Nova Scotia, June 1 – 4 2008
Health-Related Quality of Life: Health Utilities Index Mark 3 • Health-related quality of life measured by the Health Utilities Index Mark 3 (HUI3) • HUI3 assesses levels of functioning on eight attributes of health status: Vision, Hearing, Speech, Ambulation, Dexterity, Emotion, Cognition, and Pain. • HUI3 score: -0.36 0.0 1.0 (worst possible DEAD (best possible health state) health state) CPHA Annual Conference, Halifax, Nova Scotia, June 1 – 4 2008
Methods • For the overall population and then for each chronic condition subpopulation: • Sex-specific mean global HUI3 scores and 95% confidence intervals computed for income and education categories, by 10-year age group • Used survey sampling weights and the bootstrap technique to account for the complex survey design CPHA Annual Conference, Halifax, Nova Scotia, June 1 – 4 2008
Figure 1: Mean HUI3 For Poorest and Richest Deciles by 10-year Age Goup, Males 1.00 Δ=0.09 0.90 Δ=0.12 Δ=0.14 Δ=0.20 Δ=0.17 0.80 Δ=0.15 0.70 0.60 D1 (Poorest) D10 (Richest) Mean HUI3 0.50 0.40 0.30 0.20 0.10 0.00 20 30 40 50 60 70 80 Age Group CPHA Annual Conference, Halifax, Nova Scotia, June 1 – 4 2008
Figure 2: Mean HUI3 For Poorest and Richest Deciles by 10-year Age Group, Females 1.00 Δ=0.08 0.90 Δ=0.12 Δ=0.13 Δ=0.14 0.80 Δ=0.12 0.70 Δ=0.08 0.60 D1 (Poorest) Mean HUI3 D10 (Richest) 0.50 0.40 0.30 0.20 0.10 0.00 20 30 40 50 60 70 80 Age Group CPHA Annual Conference, Halifax, Nova Scotia, June 1 – 4 2008
Figure 3: Mean HUI3 for Most and Least Well-Educated Males, by 10-Year Age Group 1.00 Δ=0.08 0.90 Δ=0.10 Δ=0.07 Δ=0.10 Δ=0.09 0.80 Δ=0.08 0.70 Less than high school Bachelor’s degree or higher 0.60 0.50 Mean HUI3 0.40 0.30 0.20 0.10 0.00 20 30 40 50 60 70 80 Age Group CPHA Annual Conference, Halifax, Nova Scotia, June 1 – 4 2008
Figure 4: Mean HUI3 for Most and Least Well-Educated Females, by 10-Year Age Group 1.00 Δ=0.11 0.90 Δ=0.10 Δ=0.10 Δ=0.07 Δ=0.08 0.80 0.70 Less than high school Δ=0.03 Bachelor’s degree or higher 0.60 Mean HUI3 0.50 0.40 0.30 0.20 0.10 0.00 20 30 40 50 60 70 80 Age Group CPHA Annual Conference, Halifax, Nova Scotia, June 1 – 4 2008
Table 1: Mean HUI3 for Richest and Poorest Deciles, Men Aged 75+ With Selected Chronic Conditions CPHA Annual Conference, Halifax, Nova Scotia, June 1 – 4 2008
Table 2: Mean HUI3 for Most and Least Well-Educated Males, Aged 75+ with Selected Chronic Conditions CPHA Annual Conference, Halifax, Nova Scotia, June 1 – 4 2008
Limitations • Causality should not be inferred between socioeconomic status (SES) and health-related quality of life • Potential self-report bias on CCHS • Income concept broadly defined (based on total household income) • Limited to household population (institutional residents excluded) CPHA Annual Conference, Halifax, Nova Scotia, June 1 – 4 2008
Discussion • Robust socioeconomic disparities in health-related quality of life exist in Canada • Magnitude of these disparities often differs by age, sex, definition of SES, and health condition • Interventions directed at reducing disparities in health-related quality of life could produce substantial gains at the population level CPHA Annual Conference, Halifax, Nova Scotia, June 1 – 4 2008
Discussion • Within chronic condition subgroups, why do persons of higher SES have better health-related quality of life than lower SES persons? Possibly due to… • Higher pre-condition health status • Better condition management • Better physical and social environments • Further investigation is required to disentangle the potential reasons • Demonstrates importance of SES for burden of disease studies and cost-effectiveness analysis of treatments CPHA Annual Conference, Halifax, Nova Scotia, June 1 – 4 2008
Future Directions • Integrate mortality and health-related quality of life data to provide a more complete picture of socioeconomic differentials in health (e.g., Wolfson, McIntosh, Finès, & Wilkins, forthcoming) • Use a broader range of income concepts to define SES (e.g., personal earnings versus total household income) • Examine socioeconomic differentials in health-related quality of life for other health conditions • Investigate the pathways through which SES produces different health outcomes CPHA Annual Conference, Halifax, Nova Scotia, June 1 – 4 2008
References • Choinière R, Lafontaine P, Edwards AC. Distribution of cardiovascular disease risk factors by socioeconomic status among Canadian adults. CMAJ 2000; 162 (9 Suppl): S13-S24. • Eng K, Feeny D. Comparing the health of low income and less well educated groups in the United States and Canada. Population Health Metrics 2007; 5: 10. • Feeny D, Furlong W, Torrance GW, Goldsmith CH, Zhu Z, DePauw S, Denton M, Boyle M. Multiattribute and single-attribute utility functions for the Health Utilities Index Mark 3 system. Med Care 2002;40(2):113-28. CPHA Annual Conference, Halifax, Nova Scotia, June 1 – 4 2008
References • Marra CA, Lynd LD, Esdaile JM, Kopec J, Anis AH. The impact of low family income on self-reported health outcomes in patients care environment. Rheumatology 2004;43:1390-1397. • Patrick DL, Erickson P. Health Status and Health Policy: quality of life in health care evaluation and resource allocation. New York: Oxford University Press; 1993. • Raphael D. Health inequalities in Canada: current discourses and implications for public action. Critical Public Health 2000;10(2):193-216 CPHA Annual Conference, Halifax, Nova Scotia, June 1 – 4 2008
References • Wilkins R, Tjepkema M, Choinière R, Mustard C. The 1991 census mortality follow-up study: Cohort mortality by individual, family, household and neighbourhood characteristics, based on a 15% sample of the Canadian adult population. Health Reports (forthcoming). • Wolfson MC, McIntosh CN, Finès P, Wilkins R. Refining the measurement of health inequalities in Canada: new data, new approaches. Paper to be presented at the 30th General Conference of the International Association for Research in Income and Wealth, Portoroz, Slovenia, August 24-30, 2008. CPHA Annual Conference, Halifax, Nova Scotia, June 1 – 4 2008
Acknowledgements The guidance and feedback of Russell Wilkins and Michael Wolfson are gratefully acknowledged. CPHA Annual Conference, Halifax, Nova Scotia, June 1 – 4 2008
Contact Information Cameron N. McIntosh Analyst Health Information and Research Division 24-L R.H. Coats Building Statistics Canada | 100 Tunney's Pasture Driveway Government of Canada Ottawa, Ontario K1A 0T6 phone: 613-951-3725 | fax: 613-951-3959 email: cameron.mcintosh@statcan.ca CPHA Annual Conference, Halifax, Nova Scotia, June 1 – 4 2008