Download
1 / 48
490 likes | 623 Views
Better Care at Lower Cost: Principles of Design. Donald M. Berwick, MD, MPP President and CEO Institute for Healthcare Improvement National Conference on Health Care Reform in Massachusetts Robert Wood Johnson Foundation & AcademyHealth with the Massachusetts Health Insurance Connector

E N D
Better Care at Lower Cost:Principles of Design Donald M. Berwick, MD, MPP President and CEO Institute for Healthcare Improvement National Conference on Health Care Reform in Massachusetts Robert Wood Johnson Foundation & AcademyHealth with the Massachusetts Health Insurance Connector Boston, MA: January 21, 2010
Acute Lymphoblastic Leukemia Coronary Heart Disease Acute Myocardial Infarction ErythroblastosisFetalis Diabetes Mellitus Asthma Organ Transplantation Major Biomedical Successes
Average Health Insurance Premiums and Worker Contributions for Family Coverage, 1999-2009 $13,375 131% Premium Increase $5,791 Wage and benefits1 Increase 37% Note: The average worker contribution and the average employer contribution may not add to the average total premium due to rounding. Source: Kaiser/HRET Survey of Employer-Sponsored Health Benefits, 1999-2009. 1. Bureau of Labor Statistics Employment Cost Index
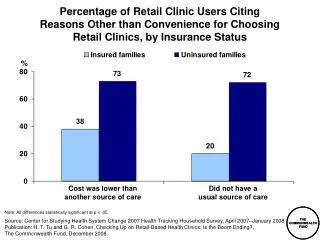
Difficulty Getting Care on Nights, Weekends, Holidays Without Going to the Emergency Room, Among Sicker Adults Percent of adults who sought care reporting “very” or “somewhat” difficult 2005 2007 United States International Comparison AUS=Australia; CAN=Canada; GER=Germany; NETH=Netherlands; NZ=New Zealand; UK=United Kingdom. Data: 2005 and 2007 Commonwealth Fund International Health Policy Survey. 3 Source: Commonwealth Fund National Scorecard on U.S. Health System Performance, 2008
Mortality Amenable to Health Care Deaths per 100,000 population* * Countries’ age-standardized death rates before age 75; including ischemic heart disease, diabetes, stroke, and bacterial infections. See report Appendix B for list of all conditions considered amenable to health care in the analysis. Data: E. Nolte and C. M. McKee, London School of Hygiene and Tropical Medicine analysis of World Health Organization mortality files (Nolte and McKee 2008). 4 Source: Commonwealth Fund National Scorecard on U.S. Health System Performance, 2008
$10,250 to 17,184 (55) 9,500 to < 10,250 (69) 8,750 to < 9,500 (64) 8,000 to < 8,750 (53) 6,039 to < 8,000 (65) Not Populated The Dartmouth AtlasRegional Variation in Medicare Spending per Capita Source: Elliott Fisher and the Dartmouth Atlas Project
What Do Highest Quintile Cost Regions Get for $3000 Extra per Capita per Year? COSTS AND RESOURCE USE…. 32% more hospital beds per capita 65% more medical specialists 75% more internists More rapidly rising per capita resource use QUALITY AND RESULTS… Technically worse care No more major elective surgery More hospital stays, visits, specialist use, tests, and procedures Slightly higher mortality Same functional status Worse communication among physicians Worse continuity of care More barriers to quality of care Lower satisfaction with hospital care Less access to primary care Lower gains in survival
Aims • Safety • Effectiveness • Patient-centeredness • Timeliness • Efficiency • Equity
“The First Law of Improvement” Every system is perfectly designed to achieve exactly the results it gets.
PARIS IN THE THE SPRING
Preventing Central Line Infections • Hand hygiene • Maximal barrier precautions • Chlorhexidine skin antisepsis • Appropriate catheter site and administration system care • Daily review of line necessity and prompt removal of unnecessary lines
Central Line Associated Bloodstream Infections (CLABs)(from Rick Shannon, MD, West Penn Allegheny Health System)
IHI’s “Rings” of Activity Prototype Innovation Dissemination 14
Sentara WilliamsburgZero Ventilator Pneumonias in Five Years!
Improving Patient Safety at Mayo Clinic (Adverse Events per 1000 Patient Days – All Sites)
Does Improving Safety Save Money? SERIOUS PREVENTABLE INFECTIONS (“PURPLE BUGS”) MRSA, C. difficile, and VRE combined annually infect at least 350,000 people, cause at least 12,000 deaths, and increase care costs by at least $5 billion
Does Improving Safety Save Money? HENRY FORD HEALTH SYSTEM
Drivers of a Low-Value Health System Low Value High Cost Low Quality New drugs and tech ≠ outcomes No mechanism to control cost at the population level Supply- Driven Demand Over- Reliance On Doctors Insignificant role for individuals and families Under- valuing “system” design
Health Care Reform: The Apparent Choice • Spend More. • Accomplish Less.
Health Care Reform: The Better Choice • Spend More. • Accomplish Less. • Change the System.
The “Triple Aim” Population Health Experience of Care Per Capita Cost
$10,250 to 17,184 (55) 9,500 to < 10,250 (69) 8,750 to < 9,500 (64) 8,000 to < 8,750 (53) 6,039 to < 8,000 (65) Not Populated The Dartmouth AtlasRegional Variation in Medicare Spending per Capita Source: Elliott Fisher and the Dartmouth Atlas Project
$10,250 to 17,184 (55) 9,500 to < 10,250 (69) 8,750 to < 9,500 (64) 8,000 to < 8,750 (53) 6,039 to < 8,000 (65) Not Populated 74 High Quality, Low Cost HRRs Source: Elliott Fisher and the Dartmouth Atlas Project
$10,250 to 17,184 (55) 9,500 to < 10,250 (69) 8,750 to < 9,500 (64) 8,000 to < 8,750 (53) 6,039 to < 8,000 (65) Not Populated 10 HRRs We StudiedPrice-Adjusted per Capita Medicare spending Everett, WA La Crosse, WI Cedar Rapids, IA Portland, ME Sayre, PA Richmond, VA Asheville, NC Sacramento, CA Temple, TX Tallahassee, FL Source: Elliott Fisher and the Dartmouth Atlas Project
What Are They Doing? They reduce the frequency of visits, specialist referrals and imaging, and they rely to a much greater extent on primary care physicians. Source: Elliott Fisher and the Dartmouth Atlas Project
What Are They Doing? The High-Performing HRR’s per capita Spending – and Spending Growth – Are Lower. Potential Annual Savings: 12.7% - 16.2% Source: Elliott Fisher and the Dartmouth Atlas Project
What Successful Communities May Have in Common • Cooperation and a Platform for Conversation • Shared Aims for the Community – “The Glue” • Positive Public Framing • Daylight – Data in Use • Restraint - “We don’t measure our success by income.” • Physician - Hospital Relationships • Stringency and Constraint (“The Mother of Invention”?) • CON, Utility Model, Medicare Payment • System Views (e.g. Shared Services – Process Focus – Lean) • Strong Primary Care Base (“Coordinated Care Providers”) • Technology to Pull Us Together • Uncertain: When Competition Helps/Hurts • Uncertain: How Much Environmental Change Is Necessary?
The “Triple Aim” Population Health Experience of Care Per Capita Cost
The Chain of Effect inImproving Health Care Quality Patient and Community Aims (safe, effective, patient-centered, timely, efficient, equitable) Experience Simple rules/Design Concepts (knowledge-based, customized, cooperative) Micro-system Process Organizational Context Facilitator of Processes Design Concepts (HR, IT, finance, leadership) Environmental Context Facilitator of Facilitators Design Concepts (financing, regulation, accreditation, education)
The Chain of Effect inImproving Health Care Quality Patient and Community Aims (safe, effective, patient-centered, timely, efficient, equitable) Experience Simple rules/Design Concepts (knowledge-based, customized, cooperative) Micro-system Process Organizational Context Facilitator of Processes Design Concepts (HR, IT, finance, leadership) Environmental Context Facilitator of Facilitators Design Concepts (financing, regulation, accreditation, education)
The Chain of Effect inImproving Health Care Quality Patient and Community Aims (safe, effective, patient-centered, timely, efficient, equitable) Experience Simple rules/Design Concepts (knowledge-based, customized, cooperative) Micro-system Process Organizational Context Facilitator of Processes Design Concepts (HR, IT, finance, leadership) Environmental Context Facilitator of Facilitators Design Concepts (financing, regulation, accreditation, education)
Drivers of Low Value Health Care Primary Drivers “More Is Better” Culture Supply Driven Demand No Mechanism to Control Cost at the Population Level Over-Reliance on Doctors Lack of Appreciation for a System Low Value Health Care
Designing for a High-Value Regional Health Care System Design Concepts Primary Drivers “More Is Better” Culture Mitigated by: 1, 2, 4 Supply Driven Demand Mitigated by: 2, 3, 6 No Mechanism to Control Cost at the Population Level Mitigated by: 3, 5, 6 Over-Reliance on Doctors Mitigated by: 1, 4, 5 Lack of Appreciation for a System Mitigated by: 1, 2, 6 • 1. Primary Care: redefined, higher capacity • General medical practice connected to other resources • Self-care designed by “lead patients and families” • 2. Reverse the cost-flow gradient • GP - specialist compacts • Make the expensive places the bottlenecks High Low Value Health Care • 3. Reclaim wasted hospital capacity • Flow optimization • Chronic disease care • 4. Patient goals at least total cost • Patient reported outcomes • Decision aids and peer to peer support 5. Focused segment: High cost, socially or medically complex • 6. Integration of regional resources • Negotiate fair arrangements • Ostrom’s design concepts
Design Concepts for High Value • Primary care: redefined, higher capacity • Reverse the cost-flow gradient • Reclaim wasted hospital capacity • Patient goals at least total cost • Focused segment: high cost, socially or medically complex • Integration of regional resources
Triple Aim Design Components • Individuals and families • Redesign of “primary care” services and structures • Population health management • Cost control platform • System integration …and an “Integrator”
The “Integrator’s” Tasks • Design: • Care and Finance Models • Ways to Engage the Population • Establish Essential Business Relationships: • Specialty Care and High-Tech Care • Community-Based Services • Measure Performance in New Ways: • Track People over Time • Measure Costs • Test and Analyze to Learn What Works • A Learning Community • Managed Experiments • Develop and Deploy Information Technology • To Integrate Across Boundaries • To Give Patients Knowledge and Control
The Future State –Most Can Be Winners CURRENT STATE BURDEN FUTURE STATE TIME
The Transition State – Hard for All CURRENT STATE TRANSITION STATE BURDEN FUTURE STATE TIME
Conditions for Pursuing the “Triple Aim” • Population budget • Discipline of a cap on total budget • Population view of health status and care needs • Measurement capacity • Capacity to integrate care experience through time and space • Capacity for proactivity • “Memory” of the person • Capacity for system redesign and execution • Leverage to mold the environment