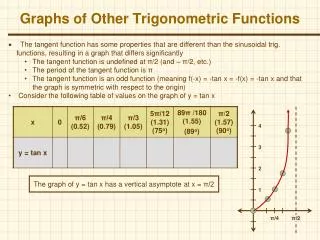
Trigonometric Graphs
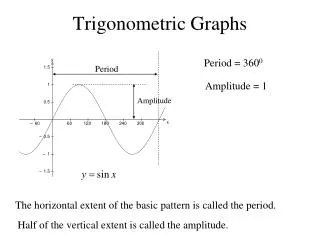
Trigonometric Graphs. Periodic Graphs. A graph with a repeating pattern is called periodic. Amplitude. Period. Amplitude = Height of function Period =Interval between repetitions. Trigonometric Graphs. Generating a sine wave. Trigonometric Graphs.


Trigonometric Graphs
E N D
Presentation Transcript
Periodic Graphs A graph with a repeating pattern is called periodic Amplitude Period Amplitude = Height of function Period =Interval between repetitions.
Trigonometric Graphs Generating a sine wave
Trigonometric Graphs Rotating a point on a circle radius 1 allows us to measure the sine of each angle and draw a graph As the point moves round the circle we can measure the sine for angles bigger than 900
Sine and Cosine Graphs Sine Cosine For both these curves Amplitude =1 Period =3600
1 x -360 90 -90 -180 0 270 180 -270 360 -1 Solving Trigonometric Equations Find all the solutions to sin(x) = 0.5 From the calculator x= 300 We can see this on the graph By drawing the line y=0.5 we can see there is another solution 300 0.5 From the symmetry of the graph this is 300 from the intercept at 1800 300 Therefore 1800 – 300 =1500 gives another solution. Second Solution 1500
Solving equations - sin Solve the equation to the nearest degree: The solution your calculator gives you is called the principle value. Use your graph to find as many other solutions as you can…
Using symmetry 370 1800 – 370 = 1430 Once we have our principle value, we can find a further angle using symmetry.
Using periodicity 370 1430 370 + 3600 1430 + 3600 370 + 7200 1430 + 7200 These are all the solutions between 00 and 9000 We can find even more solutions using periodicity.
Solving equations - cos Solve the equation to the nearest degree: The solution your calculator gives you is called the principle value. Use your graph to find as many other solutions as you can…
Using symmetry 1140 3600 – 1140 = 2460 Once we have our principle value, we can find a further angle using symmetry.
Using symmetry 2460 1140 1140 - 3600 2460 - 3600 These are all the solutions between -3600 and 3600 We can find even more solutions using periodicity.
Solving equations Remember: • Find the principle value using your calculator. • Find another solution using symmetry. 3600 • Find other solutions using periodicity.