Download
1 / 19
190 likes | 348 Views
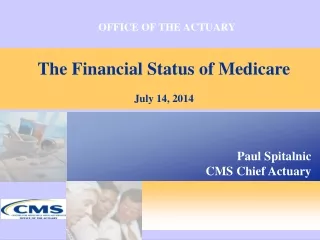
OFFICE OF THE ACTUARY. The Financial Status of Medicare Presentation for the American Enterprise Institute April 24, 2012. Richard S. Foster, FSA Chief Actuary. Chart 1—Medicare enrollment, benefits, and financing. Chart 9—Medicare Expenditures as a Percentage of GDP

E N D
OFFICE OF THE ACTUARY The Financial Status of Medicare Presentation for the American Enterprise Institute April 24, 2012 Richard S. Foster, FSA Chief Actuary
Chart 9—Medicare Expenditures as a Percentage of GDP under Current Law and Illustrative Alternative Projections
Chart 9—Medicare Expenditures as a Percentage of GDP under Current Law and Illustrative Alternative Projections Illustrative alternative to current law assumes: Physician payment “SGR” formula is overridden in all years NB: This is an illustration, not a recommendation
Chart 9—Medicare Expenditures as a Percentage of GDP under Current Law and Illustrative Alternative Projections Illustrative alternative to current law assumes: Physician payment “SGR” formula is overridden in all years Productivity adjustments to other provider updates are phased down over 2020-2034 IPAB requirements are not implemented NB: This is an illustration, not a recommendation