Download
1 / 18
180 likes | 291 Views
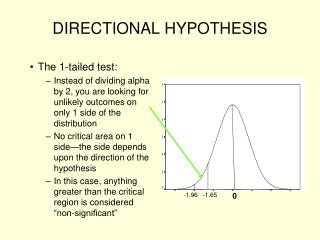
AGEC 640 – Nov. 19 th , 2013 Hypothesis Tests Regarding Agricultural Policy. Seven specific hypotheses regarding policy failure. Masters and Garcia test for standard explanations: Rational ignorance when per-person effects are small

E N D
AGEC 640 – Nov. 19th, 2013Hypothesis Tests Regarding Agricultural Policy
Seven specific hypotheses regarding policy failure Masters and Garcia test for standard explanations: • Rational ignorance when per-person effects are small • Free ridership when groups of people are large (versus more political support from larger groups) • Rent-seeking by unconstrained incumbents (versus checks-and-balances from institutions and markets) • Revenue motives for cash-strapped governments • Time consistency of policy when taxation is reversible but investment is not (as opposed to simultaneous choices) • Status-quo bias from loss aversion or conservative social welfare functions in politics • Rent dissipation from the entry of new farmers (as opposed to free riding among existing farmers)
Results:A new view of the development paradox National average NRAs by real income per capita, with 95% confidence bands Net taxation of consumers NRA>0 Tests aim to account for nonlinearity in these lines, and also dispersion around them, as well as the NRA-income relationship itself ≈$5,000/yr Export taxes with import restrictions = anti-trade bias NRA<0 Net taxation of farmers (≈$400/yr) (≈$3,000/yr) (≈$22,000/yr) Notes: Each line shows data from 66 countries in each year from 1961 to 2005 (n=2520), smoothed with confidence intervals using Stata’s lpolyci at bandwidth 1 and degree 4. Income per capita is expressed in US$ at 2000 PPP prices.
Results:A new view of policy change over time Average NRAs for all products by year, with 95% confidence bands Increased taxes on consumers in 1990s Heavy taxes on farmers in 1970s then reform Heavy taxes on consumers in the 1980s, then reform
Results:A new view of policy change over time Average NRAs for importables and exportables by year, with 95% confidence bands Trend away from taxes on exports, with rising import restrictions Heavy taxes on exports in 1970s then reform with varied import restrictions
Results: The stylized facts in OLS regressions Table 1. Stylized facts of observed NRAs in agriculture The development paradox The resource curse Some regional differences Anti-trade bias
Results:Specific hypotheses at the country level Table 2. Hypothesis tests at the country level • More protection when per-person costs are small • More financial depth, less protection Revenue Motives Rational ignorance Number of people(i.e. free-ridership) Governance • Reject this H • Better governance, less protection
Results:Specific hypotheses at the product level Table 3. Hypothesis tests at the product level • Crops with more sunk costs are taxed more Time consistency Status-quo bias • Policy changes try to reverse prior year price changes
Results:How much stabilization is achieved? Stabilization index over the 1961-2005 period, by income level When stabilizing, SI>0 SI<0 if gov’t is destabilizing Not much! Many governments actually destabilize prices(although M&G don’t have a strong counterfactual story for comparison)
Results: Richer countries stabilize more Table 4. Determinants of the stabilization index Another development paradox? Exportable crops and land-abundant countries have less stabilization Asia has more imports and less land, which explains high stabilization
More results: Since 1995, policies have moved closer to free-trade prices National average NRAs by income level, before and after the Uruguay Round agreement Shift to flatter curves post-Uruguay, closer to zero
Low-income Africa taxes farmers less, Higher-income Asia taxes consumers less National average NRAs by income level, before and after the Uruguay Round agreement Pro-farm reforms in lower-income Africa Pro-consumer reform in higher-income Asia
There has been less improvement in E. Europe-Central Asia or Latin America National average NRAs by income level, before and after the Uruguay Round agreement Less reform – lines are more similar
The biggest change has been in high-income countries National average NRAs by income level, before and after the Uruguay Round agreement US, EU and Japan: reforms and WTO commitments But recent events could change the pattern: …will a return of high food prices cause policy reversals?
Some conclusions • Three stylized facts help explain policy choices: • A development paradox from taxing farmers to taxing consumers as incomes rise • An anti-trade bias from taxation of both imports and exports • A resource abundance effect against natural resources • Three mechanisms help explain the income effect: • Rational ignorance when per-person costs are small • Improved governance from more checks and balances • Revenue motives for import taxes when financial systems are deeper
More conclusions • Four other mechanisms help add to the income effect: • More people in the sector leads to more favorable policies • Crops with more sunk costs (perennials) are taxed more • Policy changes try to reverse the last year’s price changes • Two widely-held views are not supported: • Policy changes do not try to reverse changes in area planted • Policy provides little price stabilization in poor countries
Finally… • Policy relationships have changed over time • Relative to income levels, prices are now much closer to free trade than in the past, especially in Africa, Asia and the high income countries. • The recent move to freer trade could be reversed • In particular, a return of 1970s-style food prices could easily cause a return to 1980s-style food policies. • Policy outcomes are far from predetermined! • The models explain less than half of the total variation.
…and some overall conclusionson Political Economy • Theory gives us several powerful insights: • markets fail, so collective action can help raise incomes • any of the three kinds of instruments can work (regulation, taxation or enforcement of property rights) • whether observed policies actually raise incomes depends on the ability to create, inform and enforce those policies… (success or failure of policy depends on technology, local institutions) • The empirics reveal a few clear stylized facts: • observed policies typically • provide concentrated benefits & cause diffuse losses (perhaps explained by rational ignorance, etc.) • protect against decline more than promoting growth (perhaps explained by loss aversion, uncertainty of who would gain, etc) • both kinds of asymmetry contribute to what we see • between agriculture & other sectors • within agriculture