Download
1 / 74
740 likes | 884 Views
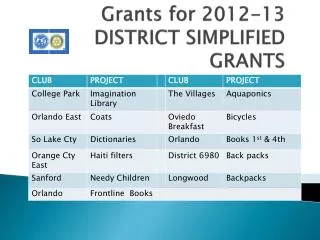
NJ SHARES Evaluation of 2012 Grants. October 25, 2013. Evaluation Goals. Characterize 2012 NJ SHARES grant recipients Characterize 2012 NJ SHARES grants Examine good faith payments Analyze post-grant payment compliance. 2. Evaluation Components. Part 1 – NJ SHARES database analysis

E N D
NJ SHARES Evaluation of 2012 Grants October 25, 2013
Evaluation Goals • Characterize 2012 NJ SHARES grant recipients • Characterize 2012 NJ SHARES grants • Examine good faith payments • Analyze post-grant payment compliance 2
Evaluation Components • Part 1 – NJ SHARES database analysis • Characterizes grant recipients • Characterizes grants • Part 2 – Utility transaction data analysis • “Good Faith” Payment Analysis • Grant Coverage Analysis • Post-Grant Payment Compliance 3
Evaluation Data • Data received from all utilities. • ACE • ETG • NJNG • PSE&G • RECO • SJG • JCP&L 4
NJ SHARES Database Analysis Number of Years of Grant Receipt 10
NJ SHARES Database Analysis Household Poverty Level Note 1: As of January 23, 2009, income eligibility is capped at 400% of poverty. Note 2: LIHEAP eligibility is for fiscal years. 13
NJ SHARES Database Analysis Household Composition Note: A household can be included in more than one category. 14
NJ SHARES Database Analysis Household Composition Note: “Single Parent” and “Elderly Only” households were identified using the age grouping variables, in the database not the variable “Category”. 16
NJ SHARES Database Analysis Recipient-Reported Bill Balance at Grant Application 18
NJ SHARES Database Analysis Mean Reported Bill Balance at Grant Application 19
NJ SHARES Database Analysis Collections Actions Pending at Application Note: Percentages may not sum to 100% because a household with grants for more than one utility may have two different collections actions. 20
NJ SHARES Database Analysis Grant Guidelines - Maximum Grant Amounts 22
NJ SHARES Database Analysis % Receiving Max Grant Allowed 24
PART 2Utility Data Analysis Methodology • Focused on Q1 2012 grant recipients • Transaction data from utilities • Files contain payments, charges, account balances • Analyzed: • Existence of “Good Faith Payment” • Grant coverage of pre-grant balances • Ratio of payments made to charges incurred at key intervals • Used Q1 2011 and Q1 2013 recipients as comparison groups 26
Utility Data Analysis Sample Group Definitions 2011 2013 2012 Q1 2012 ANALYSIS PERIOD GRANT DATE GRANT DATE + 1 DAY Q1 2011 ANALYSIS PERIOD GRANT DATE + 1 DAY GRANT DATE + 1 YEAR + 1 DAY GRANT DATE Q1 2013 ANALYSIS PERIOD GRANT DATE – 1 DAY GRANT DATE 1 YEAR 27
“Good Faith” Payment Analysis “Good Faith” Period Definition • The “Good Faith” payment period is defined as 90 days prior to intake through the day before the grant is applied to the account. • Only payments made by the customer are counted. “GOOD FAITH” PERIOD GRANT DATE INTAKE DATE – 90 DAYS INTAKE DATE GRANT DATE – 1 DAY 28
“Good Faith” Payment AnalysisAttrition Analysis * An account was eligible for analysis if the NJ SHARES grant could be located in the utility transactions data, the utility-reported account balances did not conflict with the utility transactions data, and there were at least three months of pre-grant utility data. 29
“Good Faith” Payment AnalysisPercent Making “Good Faith” Payment 30
“Good Faith” Payment AnalysisPercent Making “Good Faith” Payment By Utility 31
“Good Faith” Payment Analysis Amount of Good Faith Payments Made 32
“Good Faith” Payment Analysis Amount of Good Faith Payments MadeBy Utility 33
“Good Faith” Payment AnalysisAmount of Good Faith Payments Made By Poverty Level 34
“Good Faith” Payment Analysis Number of Payments for Those Paying at Least $100 35
Grant Coverage AnalysisAttrition Analysis * An account was eligible for analysis if the NJ SHARES grant could be located in the utility transactions data and the utility-reported account balances did not conflict with the utility transactions data. 36
Grant Coverage Analysis Grant Coverage By Main Heating Fuel 40
Payment Compliance AnalysisAttrition Analysis * An account was eligible for analysis if the NJ SHARES grant could be located in the utility transactions data and the utility-reported account balances did not conflict with the utility transactions data. 41
Payment Compliance Analysis Mean Percent of Bills Paid By Utility 44
Payment Compliance Analysis Percent That Paid More Than 90 and 100 Percent of Billed Amount 45
Payment Compliance Analysis Percent That Paid More Than 100 Percent of Billed Amount 46
Payment Compliance Analysis Percent That Paid More Than 90 Percent of Billed Amount 47
Payment Compliance Analysis Segmentation Analysis Successful (26%) 50