Download
1 / 46
470 likes | 519 Views
Drought Risk Analysis. Methods, Indicators , and Applications. Francesco Tonini PhD candidate at SFRC – GIS concentration 11/07/2012. Who Am I ?. Born in Florence, Italy B.Sc. Statistics & Information Systems (University of Florence)

E N D
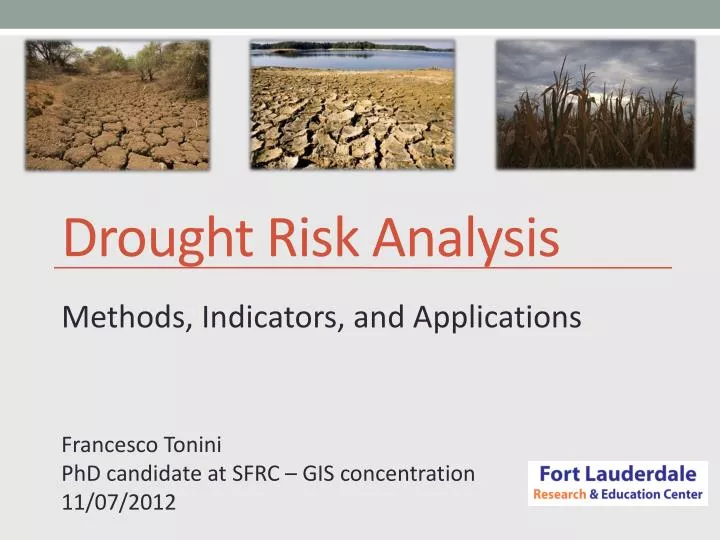
Drought Risk Analysis Methods, Indicators, and Applications Francesco Tonini PhD candidate at SFRC – GIS concentration 11/07/2012
Who Am I ? • Born in Florence, Italy • B.Sc. Statistics & Information Systems (University of Florence) • M.Sc. Statistics for Biomedicine, the Environment, and Technology (University of Rome “La Sapienza”) Present: Ph.D. candidate @ SFRC-Geomatics (University of Florida)
Credits: “African Tsunami” cartoon by Alberto Sabat Outline • Introduction • Methods • Indicators • Application: extreme values of NDVI variations in South Tigray, Ethiopia
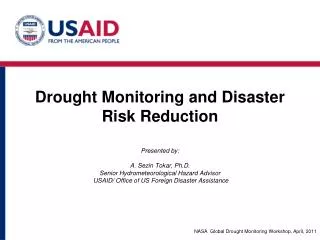
1. Introduction2. Methods3. Indicators 4. Application Introduction Differences with other extreme meteorological events: • Onset & end of a drought are difficult to determine (currently the least predictable) • No universal definitions:quantification of impact and provision for relief far more difficult • Greatest detrimental impact in the 20th century. Often on a large scale 1st for number of people affected • Human activities can directly trigger a drought: overfarming, excessive irrigation, deforestation, over-exploitation of available water, erosion
1. Introduction2. Methods3. Indicators 4. Application Introduction (cont.) NASA’s Earth Observatory • Agricultural drought: soil lacks moisture that a specific crop would need at a specific time • Meteorological drought: negative deviations of long-term precipitation from the norm • Hydrological drought: lack of sufficient surface and subsurface water supplies
1. Introduction2. Methods3. Indicators 4. Application Introduction (cont.) • Socio-economic drought: water scarcity starts affecting people’s lives
1. Introduction2. Methods3. Indicators 4. Application Introduction (cont.) Source: National Drought Mitigation Center http://www.drought.unl.edu/
1. Introduction2. Methods3. Indicators 4. Application Introduction (cont.) Precipitation Runoff Soil Moisture Streamflow Ground Water
1. Introduction2. Methods3. Indicators 4. Application Methods
1. Introduction2. Methods3. Indicators 4. Application Methods (cont.) • Assessment of drought conditions is more accurate when the variable of interest is measured in situ • Ideally, ground stations would be uniformly located and closely spaced in order to get the best information • Costs associated with a dense spatial coverage are high (economic & human resources availability)
1. Introduction2. Methods3. Indicators 4. Application Methods (cont.) • Existing literature suggests several methods that have been developed to measure different types of drought • Drought indicators can be divided into two main categories: ground-based or satellite-based, depending on their derivation
1. Introduction2. Methods 3. Indicators 4. Application Indicators Ground-based Indicators
1. Introduction2. Methods 3. Indicators 4. Application Indicators (cont.) Meteorological drought:defined on the basis of degree of dryness • Indicators expressed in terms of rainfall deficit in relation to some average amount & duration of drought period • Must be considered as region specific (thresholds for that study area) • Most drive by rainfall variations: • Palmer Drought Severity Index (PDSI) • Standard Precipitation Index (SPI) • Deciles
1. Introduction2. Methods 3. Indicators 4. Application Indicators (cont.) Palmer Drought Severity Index (PDSI) -developed by Wayne Palmer in the 1960s- • Index based on supply-demand concept of water balance equation • It provides measurements of moisture conditions that were standardized to facilitate comparison between locations and months • Calculation based on precipitation, temperature, and available water content (AWC) of the soil
1. Introduction2. Methods 3. Indicators 4. Application Indicators (cont.)
1. Introduction2. Methods 3. Indicators 4. Application Indicators (cont.) PROS: • Most effective in determining long-term drought (i.e. a matter of several months) • Spatial and temporal presentation of historical droughts CONS: • Not as good with conditions for short-term drought (i.e. a matter of weeks) • Must have sufficient precipitation and temperature data available • Snowfall, snowcover, and frozen ground are not accounted for (may not be accurate in winter or spring) • Tends to underestimate runoff conditions
1. Introduction2. Methods 3. Indicators 4. Application Indicators (cont.) Standardized Precipitation Index (SPI) -developed by Mckeeet al. 1993- • Based on the consideration that a deficit of precipitation has different impact on ground water, reservoir storage, soil moisture, snowpack, and streamflow • Most common drought monitoring index • Drought onset & duration • SPI is the number of standard deviations left (drought) or right (wet) from 0
1. Introduction2. Methods 3. Indicators 4. Application Indicators (cont.) Frequencies of extreme drought events are comparable between different locations
1. Introduction2. Methods 3. Indicators 4. Application Indicators (cont.) PROS: • Simplicity (only rainfall data required) • Variable time scale (meteorological, agricultural, hydrological drought) • Standardization (frequency of extreme drought events at any location and time scale are consistent) CONS: • Suitable theoretical probability distribution, which can model raw data • Extreme droughts (over longer period) occur with same frequency on all locations – SPI cannot identify drought prone regions • Areas with small seasonal precipitation – misleading large positive or negative SPI values may result
1. Introduction2. Methods 3. Indicators 4. Application Indicators (cont.) Deciles–developed by Gibbs and Maher, 1967- • Groups monthly precipitation occurrences into deciles so that, by definition, “much lower than normal” weather cannot occur more often than 20% of the time • Easy to calculate and requires less data and fewer assumptions than the Palmer Drought Severity Index • Used in Australia: farmers and ranchers can only request government assistance if the drought is shown to be an event that occurs only once in 20–25 years
1. Introduction2. Methods 3. Indicators 4. Application Indicators (cont.)
1. Introduction2. Methods 3. Indicators 4. Application Indicators (cont.) PROS: • Provides an accurate statistical measurement of precipitation CONS: • Accurate calculations require a long climatic record
1. Introduction2. Methods 3. Indicators 4. Application Indicators (cont.) Agricultural drought: crop needs • Links various categories of meteor. & hydrol. drought to agricultural impacts • Focused primarily on soil water deficits and differences between actual and potential evapotranspiration (PET) • A good indicator should account for variable susceptibility of crops during different stages of crop development (i.e. from emergence to maturity) • Requires calculation of water balance on weekly scale during growing season
1. Introduction2. Methods 3. Indicators 4. Application Indicators (cont.) Crop Moisture Index (CMI) –developed by Palmer 1968- • Derivative of PDSI. Developed to assess short-term moisture supply over major crop-producing areas • Uses a meteorological approach to monitor week-to-week crop condition • Based on the mean temperature and total precipitation for each week within a climate division, as well as the CMI value from the previous week. • CMI looks at the top 5 feet of the soil layer
1. Introduction2. Methods 3. Indicators 4. Application Indicators (cont.) PROS: • Identifies potential agricultural droughts • Responds rapidly to changing conditions. It can detect drought sooner than PDSI CONS: • Not a good long-term drought monitoring tool. CMI’s rapid response to changing short-term conditions may provide misleading information about long-term conditions
1. Introduction2. Methods 3. Indicators 4. Application Indicators (cont.)
1. Introduction2. Methods 3. Indicators 4. Application Indicators (cont.) Hydrological drought: effects of periods of rain shortfall on surface and subsurface water supply • Groundwater drought is outlined by lower than average annual recharge for more than one year • Groundwater levels are good indicators in an acquifer area • Hydrological drought sets slower and lasts longer compared to meteorological drought
1. Introduction2. Methods 3. Indicators 4. Application Indicators (cont.) Palmer Hydrological Drought Severity Index (PHDSI) –developed by Karl & Knight, 1985- • Derived from the PDSI • Based on moisture inflow (precipitation), outflow, and storage, and does not take into account the long-term trend
1. Introduction2. Methods 3. Indicators 4. Application Indicators (cont.) PROS: • Officially used by National Climatic Data Center (NCDC) to determine the precipitation needed for drought termination and amelioration which has a PHDI equal to -0.5 and -2.0 consecutively CONS: • The PHDI is developed from precipitation, outflow, and storage. PHDI may change more slowly than PDSI and it has sluggish response for drought
1. Introduction2. Methods 3. Indicators 4. Application Indicators (cont.) Surface Water Supply Index (SWSI) –developed by Shafer and Dezman, 1982- • Used for frequency analysis to normalize long-term data such as precipitation, snow pack, stream flow, and reservoir level • Designed to complement the Palmer Index for moisture conditions across the state of Colorado • Shafer and Dezman described it as “mountain water dependent”, in which mountain snowpack is a major component
1. Introduction2. Methods 3. Indicators 4. Application Indicators (cont.) PROS: • Represents water supply conditions unique to each basin CONS: • Changing a data collection station or water management requires that new algorithms be calculated, and the index is unique to each basin, which limits inter-basin comparisons
1. Introduction2. Methods 3. Indicators 4. Application Indicators Satellite-based Indicators
1. Introduction2. Methods 3. Indicators 4. Application Indicators (cont.) Rainfall Estimate (RFE) –developed by Xieand Arkin, 1997- • Developed to estimate precipitation over Africa and complement the information available from the sparse network of ground stations • Combines information on cloud temperature and cold cloud persistence with rainfall measured by rain gauge stations • Measuring total rainfall at the end of a season has proven to be too crude of an indicator for estimating the potential impact of rainfall deficits on production and livelihoods
1. Introduction2. Methods 3. Indicators 4. Application Indicators (cont.) Water Requirement Satisfaction Index (WRSI) –developed by Frere and Popov, 1986- • Meaningful indicator of how a shortage of rainfall may impact crop yields and the availability of pasture • Monitors water deficits throughout the growing season, and captures the impact of timing, amount and distribution of rainfall on staple annual rain-fed crops • Basis on many drought early warning tools for the continent • RFE data is used as the primary input into the WRSI model
1. Introduction2. Methods 3. Indicators 4. Application Indicators (cont.) Persendt(2009) divides satellite-based drought indicators into three groups: (i) Indices based on the state of the vegetation, extrapolated using the reflective channels: -Normalized Difference Vegetation Index (NDVI), Vegetation Condition Index (VCI) (ii) Indices based on surface brightness temperature, extrapolated from the thermal channels: -Temperature Condition Index (TCI) (iii) Indices based on a combination of (i) and (ii): -Ratio between Land Surface Temperature (LST) and NDVI, Vegetation Health Index (VHI)
1. Introduction2. Methods 3. Indicators 4. Application Indicators (cont.) Normalized Difference Vegetation Index (NDVI)–developed by Tucker, 1979- NDVI = (NIR - VIS) / (NIR + VIS)
1. Introduction2. Methods 3. Indicators4. Application Application “Mapping return levels of absolute NDVI variations for the assessment of drought risk in Ethiopia” Tonini, F., JonaLasinio, G., Hochmair, H. 2012. Int. J. App. Earth Obs. & Geoinf., 18, p. 564-572.
1. Introduction2. Methods 3. Indicators4. Application Application Study Area
1. Introduction2. Methods 3. Indicators4. Application Application Available Data • The Vision on Technology (VITO) agency processes all data received from the vegetation instrument on board the SPOT-4 and SPOT-5 satellite, archives the processed data, compiles the image catalogue, and forward finished products to users • Spatial resolution 1 km x 1 km (0.8 degrees), with a spatial accuracy equal to 300 meters • Temporal resolution: April 1998 to March 2009 • 10-day mean composite. Dekadal frequence
1. Introduction2. Methods 3. Indicators4. Application Application Available Data Absolute Difference NDVI (i.e. ADVI) • Shift of the actual value from the historical average of the same reference dekad, thus showing positive or negative anomalies
1. Introduction2. Methods 3. Indicators4. Application Application Extreme Value Theory Model Approaches The extreme value theory deals with the modeling of extreme observations • Block Maxima: Generalized Extreme Value (GEV) distribution to model values found in the tails of the distribution of observed values • Peak-over-threshold (POT): Generalized Pareto Distribution (GPD) to model all observations exceeding a certain threshold
1. Introduction2. Methods 3. Indicators4. Application Application Exploratory Data Analysis: ACF & PACF on raw dekadal data
1. Introduction2. Methods 3. Indicators4. Application Application Exploratory Data Analysis: ACF & PACF on montly minima
1. Introduction2. Methods 3. Indicators4. Application Application Results: computation of ADVI Return Levels • N-month ADVI return levels are values associated with the return period 1/N and are expected to be exceeded on average once every N months • For example, if N=10 (based on your reference time unit, in this case a month since we are using monthly minima): • 10-month RL are those values with a 10% probability of being exceeded in any month. 100-months RL (~8 years) with probability 1%. 1000-months RL (~88 years) with probability 0.1% etc.
1. Introduction2. Methods 3. Indicators4. Application Application (a) 10-month (b) 100-month (c) 1000-month RL for ADVI
Thank you for your attention!…Questions? For further information, please contact: ftonini@ufl.edu Set of R functions developed are freely available: https://github.com/f-tonini/Extreme-Values-For-Gridded-Data