Download
1 / 20
200 likes | 295 Views
Analysis of top occupations facing injuries/illnesses in 2003, their stats, and comparison to employment shares; insights on days away from work and industry impact.

E N D
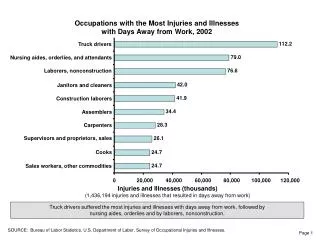
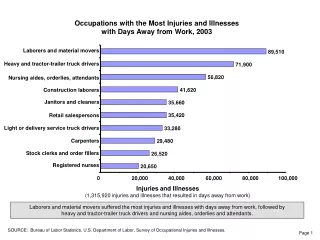
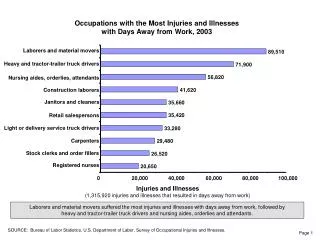
Occupations with the Most Injuries and Illnesses with Days Away from Work, 2003 Laborers and material movers 89,510 Heavy and tractor-trailer truck drivers 71,900 56,820 Nursing aides, orderlies, attendants Construction laborers 41,620 Janitors and cleaners 35,660 35,420 Retail salespersons Light or delivery service truck drivers 33,280 Carpenters 29,480 Stock clerks and order fillers 26,520 Registered nurses 20,650 0 20,000 40,000 60,000 80,000 100,000 Injuries and Illnesses (1,315,920 injuries and illnesses that resulted in days away from work) Laborers and material movers suffered the most injuries and illnesses with days away from work, followed by heavy and tractor-trailer truck drivers and nursing aides, orderlies and attendants. SOURCE: Bureau of Labor Statistics, U.S. Department of Labor, Survey of Occupational Injuries and Illnesses.
Shares of Employment and Nonfatal Injuries and Illnesses for Occupations with the Most Injuries and Illnesses, 2003 10% 9% 8% Percentage of injuries and illnesses 7% Percentage of employment 6% 5% 4% 3% 2% 1% 0% Stock clerks and order filers Retail salespersons Construction laborers Registered nurses Laborers and material movers Carpenters Janitors and cleaners Nursing, psychiatric, home health aides Drivers/sales workers and truck drivers Drivers/sales workers and truck drivers; laborers and material movers; nursing, psychiatric, and home health aides; construction laborers, janitors and cleaners; carpenters; and stock clerks and order filers experienced a higher percentage of injuries and illnesses than their employment share. Retail salespersons and registered nurses experienced a lower percentage of injuries and illnesses than their employment share. NOTE: CPS employment data was not available for heavy and tractor-trailer truck drivers; light or delivery service truck drivers; and nursing aides, orderlies, and attendants. These occupations were included in higher level detail on this chart. SOURCE: Bureau of Labor Statistics, U.S. Department of Labor, Survey of Occupational Injuries and Illnesses.
Percentage employment Percentage injuries/illnesses Employment and Nonfatal Injuries and Illnesses by Occupation Group, 2003 13.0% Management, Business, and Financial 2.0% 16.6% Professional and Related 6.6% 16.0% Service 21.3% 12.9% Sales and Related 6.6% 15.0% Office and Administrative Support 8.1% 0.9% Farming, Fishing, and Forestry 1.2% 5.8% Construction and Extraction 11.5% 4.0% Installation, Maintenance, and Repair 8.3% 8.8% Production 14.3% 7.0% Transportation and Material Moving 19.8% Not reported 0.3% 0.0% 5.0% 10.0% 15.0% 20.0% 25.0% Employment - Current Population Survey, Private Wage and Salary Workers Total injuries and illnesses = 1,315,920 Transportation and material movers; production workers; installation, maintenance, and repair workers; construction and extraction workers, and service workers had a much higher share of injuries and illnesses than their employment share would suggest. SOURCE: Bureau of Labor Statistics, U.S. Department of Labor, Survey Occupational Injuries and Illnesses.
Occupations with the Highest Median Days Away from Work, 2003 Heavy and tractor-trailer truck drivers 14 Industrial machinery mechanics 12 Industrial truck and tractor operators 11 Light or delivery services truck drivers 11 Packers and packagers, hand 10 First-line supervisors/managers of construction 10 Driver/sales workers 10 Electricians 10 Assemblers and fabricators, all other 10 Home health aides 9 Construction laborers 9 All occupations 8 2 4 6 8 10 12 14 16 0 Median days away from work Of the occupations with at least 1/2% of the total days away from work cases, heavy and tractor-trailer truck drivers had a median of 14 days. Industrial machinery mechanics had a median of 12 days. Industrial truck and tractor operators and light or delivery services truck drivers each had a median of 11 days. This compared to a median of 8 days for all occupations. SOURCE: Bureau of Labor Statistics, U.S. Department of Labor, Survey of Occupational Injuries and Illnesses.
Injuries and Illnesses with days away from work Employment (BLS- Quarterly Census of Employment and Wages) (Total = 1,315,920 injuries and illnesses) Employment and Nonfatal Injuries and Illnesses by Major Industry, 2003 Goods producing industries Goods producing industries 21.5% 31.0% 78.5% 69.0% Service producing industries Service producing industries Good-producing industries make up about 21 percent of private industry employment but account for 31 percent of the injuries and illnesses with days away from work while service producing industries make up about 79 percent of the employment and 69 percent of the injuries and illnesses. SOURCE: Bureau of Labor Statistics, U.S. Department of Labor, Survey of Occupational Injuries and Illnesses.
Hours Worked and Nonfatal Injuries and Illnesses by Gender of Worker, 2003 Women Women 35.0% 41.4% 65.0% 58.6% Men Men Injuries and Illnesses with days away from work Hours worked (Total = 1,315,920 injuries and illnesses) Chart excludes unreported data. (Current Population Survey, Private Wage and Salary Workers) Almost two-thirds of the injured or ill workers were men, well above their 59 percent share of the nation’s hours worked. SOURCE: Bureau of Labor Statistics, U.S. Department of Labor, Survey of Occupational Injuries and Illnesses.
Hours Worked and Nonfatal Injuries and Illnesses by Age of Worker, 2003 3.3% 1.9% 2.3% 3.2% 16 - 19 10.2% 20 - 24 10.7% 10.3% 11.1% 25 - 34 35 - 44 45 - 54 21.9% 22.6% 24.3% 55 - 64 24.2% 65+ 27.5% 26.6% Injuries and Illnesses with days away from work Hours worked (Current Population Survey, Private Wage and Salary Workers) (Total = 1,315,920 injuries and illnesses) Chart excludes unreported data. A majority of injured or ill workers were 20 to 44 years old. Workers 20 to 44 had a slightly higher share of injuries and illnesses, while workers 45 and older had a somewhat lower share, than each of their hours worked shares suggest. SOURCE: Bureau of Labor Statistics, U.S. Department of Labor, Survey of Occupational Injuries and Illnesses.
Median Days Away from Work Due to Nonfatal Occupational Injury and Illness by Age of Worker, 2003 65 and over 18 55 to 64 12 11 45 to 54 35 to 44 9 Age of worker 25 to 34 6 All agesmedian 20 to 24 5 4 16 to 19 14 to 15 3 0 2 4 6 8 10 12 14 16 18 20 Median days away from work The median days away from work due to nonfatal occupational injuries and illnesses increased as the age of the worker increased. SOURCE: Bureau of Labor Statistics, U.S. Department of Labor, Survey of Occupational Injuries and Illnesses.
Nonfatal Occupational Injuries and Illnesses by Length of Service, 2003 Not reported0.7% Less than 1 year 23.0% Less than 1 year More than 5 years More than 5 years 30.6% 32.1% 45.8% 1 year to 5 years 31.2% 1 to 5 years 36.6% Employment Injuries and Illnesses (Current Population Survey, Private Wage and Salary WorkersJanuary 2004) (Total =1,315,920 injuries and illnesses) Workers who were with their employers for more than 5 years became injured or ill less often than their employment share suggests. SOURCE: Bureau of Labor Statistics, U.S. Department of Labor, Survey of Occupational Injuries and Illnesses.
Injury and Illness Topology Nature ofdisablingcondition Part of bodyaffected Nurse sprains her back while lifting her patient Sourcedirectlyproducingdisability Eventorexposure Each injury or illness is described from four viewpoints. SOURCE: Bureau of Labor Statistics, U.S. Department of Labor, Survey of Occupational Injuries and Illnesses.
Incidence rates of occupational injuries and illnesses involving days away from work due to contact with objects/equipment, falls to same level, and overexertion, 2003 Private industry Goods producing Natural resources and mining Construction Manufacturing Service providing Contact with objects/equipment Trade, transportation, and utilities Fall to same level Information Overexertion Financial activities Professional and business services Education and health services Leisure and hospitality Other services 0 10 20 30 40 50 60 70 80 90 100 Incidence rates represent the number of injuries and illnesses involving days away from work per 10,000 full-time workers In goods producing industries, contact with objects and equipment and overexertion were the leading causes of injuries and illnesses. In service providing industries, these same two events along with falls to the same level were the leading causes. SOURCE: Bureau of Labor Statistics, U.S. Department of Labor, Survey of Occupational Injuries and Illnesses.
The Nature of the Disabling Condition, Occupational Injuries and Illnesses with Days Away from Work, 2003 Multiple injuries Tendonitis 3.6% Soreness, pain, except back 0.6% Carpal tunnel syndrome 5.0% 1.7% Back pain 2.8% Amputations 0.6% Chemical burns All other 0.6% 16.0% Heat burns 1.5% Bruises, contusions 9.0% Cuts, lacerations, punctures 8.4% Sprains, strains 42.9% Fractures 7.2% Nature of Injury or Illness (1,315,920 injuries and illnesses that resulted in days away from work) Sprains and strains accounted for 563,910 cases or 43 percent of all nonfatal occupational injuries and illnesses. SOURCE: Bureau of Labor Statistics, U.S. Department of Labor, Survey of Occupational Injuries and Illnesses.
The Part of Body Affected, Occupational Injuries and Illnesses with Days Away from Work, 2003 Percent 25.0% 23.1% 22.7% 21.2% 20.0% 15.0% 12.8% 9.9% 10.0% 5.0% 3.6% 2.8% 1.6% 1.4% 0.8% 0.0% Multiple body parts Neck Back Upper extrem- ities Trunk, except back Head, except eye Eye Body systems Other Lower extrem- ities The back and the upper extremities were involved in almost one-half of all occupational injuries and illnesses. SOURCE: Bureau of Labor Statistics, U.S. Department of Labor, Survey of Occupational Injuries and Illnesses.
Nonfatal Occupational Injuries and Illnesses by Source of Injury or Illness, 2003 Chemicals, chemical products 1.5% All other Containers 14.5% 13.1% Furniture, fixtures Health care patient 3.6% 4.8% Machinery 6.2% Vehicles 8.3% Parts and materials Handtools 9.6% 4.4% Floor, ground surfaces Worker motion or position 18.8% 15.4% Source of Injury or Illness (1,315,920 injuries and illnesses that resulted in days away from work) Four sources accounted for over half of all nonfatal injuries and illnesses that resulted in days away from work: floor, ground surfaces 18.8%; worker motion or position 15.4%; containers 13.1%; and parts and materials 9.6%. SOURCE: Bureau of Labor Statistics, U.S. Department of Labor, Survey of Occupational Injuries and Illnesses.
The Manner in Which the Disabling Condition Occurred, Occupational Injuries and Illnesses with Days Away from Work, 2003 45% 42.1% 40% 35% 30% 26.0% 25% 20.2% 20% 15% 10% 4.4% 4.2% 5% 1.7% 1.2% 0.2% 0% Bodily reaction and exertion Contact with objects and equipment Falls Transportation accidents Exposure to harmful substances Assaults and violent acts Fires and explosions Other Bodily reaction and exertion, contact with objects and equipment, and falls accounted for almost 90% of nonfatal injuries and illnesses that resulted in days away from work. SOURCE: Bureau of Labor Statistics, U.S. Department of Labor, Survey of Occupational Injuries and Illnesses.
Median Days Away from Work Due to Nonfatal Occupational Injuries or Illnesses by Nature, 2003 Carpal tunnel syndrome 32 Amputations 30 Fractures 30 Tendonitis 11 Multiple injuries 9 Sprains, strains, tears 8 Heat burns 5 All natures 8 days Bruises, contusions 4 Cuts, lacerations 4 Chemical burns 2 0 5 10 15 20 25 30 35 Median days away from work Carpal tunnel syndrome had a median of 32 days away from work, followed by amputations and fractures with 30 days each. SOURCE: Bureau of Labor Statistics, U.S. Department of Labor, Survey of Occupational Injuries and Illnesses.
Median Days Away from Work Due to Nonfatal Occupational Injuries or Illnesses by Part of Body, 2003 Shoulder 18 Wrist 17 Knee 14 Multiple parts 10 Lower extremities 9 Trunk 9 Neck 8 Foot, except toe 7 Upper extremities 7 Back 7 All parts of body 8 days Toe 6 Finger 5 Hand, except finger 5 Body systems 4 Eye 2 Head 2 0 2 4 6 8 10 12 14 16 18 20 Median days away from work Injuries and illnesses to the shoulder (18 days), wrist (17 days), and to the knee (14 days) took the longest median time from which to recover. SOURCE: Bureau of Labor Statistics, U.S. Department of Labor, Survey of Occupational Injuries and Illnesses.
Median Days Away from Work Due to Nonfatal Occupational Injuries or Illnesses by Event or Exposure, 2003 Repetitive motion 22 Fall to lower level 15 Transportation accidents 14 Fires and explosions 10 Overexertion 10 Overexertion in lifting 9 Fall to same level 9 Slips, trips, loss of balance - without fall 8 Caught in equipment 8 Assaults and violent acts by person All events 8 days 5 Struck against object 5 Struck by object 5 Exposure to harmful substances 3 0 5 10 15 20 25 Median days away from work Repetitive motion, with a median of 22 days, resulted in the longest absences from work among the leading events and exposures. Falls to a lower level with 15 days and transportation accidents with 14 days had the next longest median days away from work. SOURCE: Bureau of Labor Statistics, U.S. Department of Labor, Survey of Occupational Injuries and Illnesses.
Median Days Away from Work Due to Nonfatal Occupational Injuries or Illnesses by Source, 2003 Worker motion or position 12 Vehicles 11 Floors, walkways, ground surfaces 10 Containers 9 Parts and materials 7 Machinery 7 All sources 8 days Health care patient 6 Tools, instruments, and equipment 5 Furniture and fixtures 5 Chemicals and chemical products 3 0 2 4 6 8 10 12 14 Median days away from work Of the source of the injury or illness, worker motion or position; vehicles; floors, walkways, ground surfaces; and containers had medians higher than the national median days away from work. SOURCE: Bureau of Labor Statistics, U.S. Department of Labor, Survey of Occupational Injuries and Illnesses.
Musculoskeletal Disorders with Days Away from Work by Nature of Injury or Illness, 2003 Back pain, hurt back 5.4% Soreness, pain, hurt, except the back 5.0% Carpal tunnel syndrome 5.1% Hernia 4.8% MSD system and connectivetissue diseases and disorders, except tendonitis 2.0% Sprains, strains, tears 76.1% Tendonitis 1.5% Nature of Injury or Illness (435,180 MSD cases that resulted in days away from work) Sprains, strains, and tears accounted for over three-fourths of the musculoskeletal disorders that resulted in days away from work in 2003. SOURCE: Bureau of Labor Statistics, U.S. Department of Labor, Survey of Occupational Injuries and Illnesses.