Download
1 / 23
230 likes | 431 Views
Financial Statements for Small Business Management. Dr. Alex White Ag & Applied Economics axwhite@vt.edu 540-231-3132 http://faculty.agecon.vt.edu/alexwhite/. Outline. Why you need financial statements What financial statements you need Construction of statements

E N D
Financial Statements for Small Business Management Dr. Alex White Ag & Applied Economics axwhite@vt.edu 540-231-3132 http://faculty.agecon.vt.edu/alexwhite/
Outline • Why you need financial statements • What financial statements you need • Construction of statements • Start-up capital exercise • Labor cost exercise • Balance sheet exercise • Breakeven analysis • Ratio Analysis
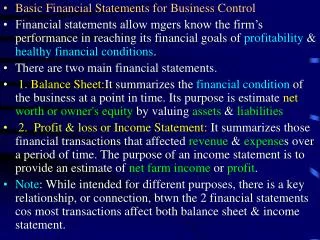
Why you need ‘em • Applying for loans • Start-up loans, operating loans/lines, etc. • Typical loan application (“loan app”) • 2-3 years of balance sheets, income statements • Historical, projected • Impress your lender with: • Cash flow statement and breakevens • Best/worst case scenarios
Why you need ‘em • Powerful management tools • Compare the business to the industry averages • Identify strengths/weaknesses of the business • Identify trends within the business • Identify strategies to improve • Enterprise analysis!! (woo hoo!!) • Helps with tax preparation • Improved recordkeeping
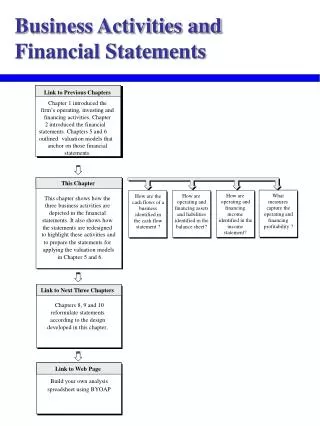
The Main Statements • Balance sheet • Listing of what you own and how you paid for it • Assets = Liabilities + Net Worth • Value of Assets = Debt financing + “Owner financing” • Tells lender • Liquidity and solvency position • Outstanding debts, creditors • Assets available for collateral • Not a useful day-to-day tool for managers
The Main Statements • Income Statement • Shows the economic profit for the period (year) • Revenues – COGS – Overhead = EBT • Cash vs accrual accounting • Lenders & managers use to assess: • Profitability, Repayment ability, and Financial efficiency • Breakevens, sensitivity analysis • Retail operations usually do a weekly income statements
The Main Statements • Cash Flow Statement (Budget) • Shows all cash coming in/going out and the timing • Helps the lender and manager: • Estimate cash surplus/deficits for each period • Shift the timing of cash flows • Determine when to schedule loan payments • Determine operating loan needs and terms • IMO – the most powerful statement for managers
Using Financial Statements • Calculate ratios and measures • Compare to benchmarks (RMA, S&P, etc.) • Available at libraries • Usually at the reference desk • Robert Morris Associates – Annual Statement Studies • Look for trends over time • Compare years side-by-side
Building the Statements • Alex’s preferred method • Start-up capital worksheet • Labor cost budgets • Balance sheet (Day 1, Year 1) • Projected cash flow statement • Projected income statement • Projected balance sheet (Day 1, Year 2) • Yadda yadda yadda
Start-up Capital Worksheet • Makes you think about all the assets you will need before opening the doors • How you will pay for each item • Owner capital (cash or net worth) • Term loan • “Hard assets” - machinery, equipment, real estate, improvements • Operating loan/line • “Operating assets” – inventory, prepaids, etc. • Use a 10-25% fudge factor
Labor Cost Estimate • For each “type” of employee • Manager, cashier, etc. • Estimates the payroll taxes • FICA, FUTA, Medicare, worker’s comp. • Estimates cost of non-cash benefits • Insurance, retirement, uniform, company car, etc. • Determines $cost/hour and $value/hour • Useful in budgeting and negotiation!
Balance Sheet • Assets = Value of things used in the business • Only what you have that day!! • Current Assets = life of about 1 year or less • Cash, savings, inventory, A/Rec., prepaids, supplies, etc. • Non-current Assets = life greater than 1 year • Machinery, equipment, real estate, improvements • List each at its purchase cost • Lenders want market value instead!
Balance Sheet • Liabilities = what you owe as of that day • Current Liabilities = owed within 1 year • Operating loan, A/Pay., principal due, accrued interest • Non-current liabilities = owed AFTER 1 year • Remaining principal balances • List the actual dollar amount owed as of that day • Net Worth = owner’s investment as of that day • Original cash invested – withdrawals + additions • Retained Earnings ~ net income from previous years
Cash Flow Statement • Cash “Budget” • List cash inflows WHEN they occur • List cash outflows WHEN they occur • Bottom half deals with operating loan • Thank goodness for computers! • Helps you do your projected balance sheet & income statement
Income Statement • List of revenues and expenses • “Cheater’s” method = use total column of cash flow statement • Except for principal payments, income taxes • Add depreciation • For “accrual” statements • Need to account for changes in inventories, payables, receivables, etc.
Projected Balance Sheet • From cash flow stmt • Cash balance • Operating loan balance & accrued interest • Adjust other asset values as needed • Add another year of depreciation on hard assets • From income statement • Net income helps determined retained earnings • 4-step process for loans
Breakeven Analysis • Measure of minimum performance needed • 1,000s of ways to calculate BEs • Key equation • (Price – COGS) x Qty sold – Overhead = $0 • BE qty. = Overhead / (Price – COGS) • BE Price = Overhead / Qty Sold + COGS
Ratio Analysis & Benchmarks • RMA Annual Statement Studies • Indexed by NAICS codes • By Sales, by Assets, by Year • Top, middle, bottom quartiles • Compare ratios to benchmarks • Look for trends over time • That’s why lenders want 2-3 years of statements
Ratio Analysis • Identify strengths and weaknesses • Develop strategies to improve the financial condition • Cost control • Pricing • Marketing • Debt structure • Labor efficiency, etc.
Financial Ratios • Liquidity – ability to meet current obligations • Current Ratio current assets/current liabilities • Quick Ratio (current asset – inventory)/cur. liab. • Solvency – ability to meet all debts • Debt/Asset total liabilities/total assets • Debt/Worth total liabilities/net worth
Financial Ratios • Repayment ability • EBIT/Interest EBIT/Interest • Debt Coverage Ratio (EBT + other income + Depreciation + Interest Expense – Taxes & Family Living) / Annual P&I payments • Profitability • ROA EBT/Total Assets • ROE EBT/Net Worth
Financial Ratios • Financial Efficiency • Sales/Total Assets • COGS/Sales • Operating Exp/Sales • Operating Profit Margin EBT/Sales
Spreadsheet Template • http://faculty.agecon.vt.edu/alexwhite/ • Go to the Small Business tab • Built as a teaching tool for start-up businesses • Excel 2003 • Can be used for existing businesses