Download
1 / 45
450 likes | 664 Views
Terminal Decline and Ergodicity in Life Satisfaction. Ryne Estabrook September 13, 2007 Design and Data Analysis.

E N D
Terminal Decline and Ergodicity in Life Satisfaction Ryne Estabrook September 13, 2007 Design and Data Analysis Gerstorf, D., Ram, N., Estabrook. R., Schupp, J., Wagner, G.G. \& Lindenberger, U. (2008). Life Satisfaction Shows Terminal Decline in Old Age: Longitudinal Evidence from the German Socio-Economic Panel Study (SOEP). Developmental Psychology, 44, 4, 1148-1159.
Terminal Decline and Ergodicity In Life Satisfaction Terminal Decline • Terminal decline has long been studied as a late-life cognitive phenomenon. • Kleemeier, 1962; see Bäckman & MacDonald, 2006 for review. • Terminal decline can be defined in a number of ways: • All definitions describe negative (or more negative) change. • Some differentiate between terminal drop (accelerated or curvilinear declines) and terminal decline (level differences). • Often a methodological distinction. • These two phenomena often termed together as terminal change.
Terminal Decline and Ergodicity In Life Satisfaction Terminal Decline • Evidence of terminal decline over a range of cognitive functions. • Areas of cognitive functioning relatively unaffected by age show the most pronounced and consistent terminal decline effects. • White and Cunningham (1988) hypothesis. • Vocabulary, crystallized abilities, episodic & working memories. • Differences between survivors and decedents found anywhere from two to twelve years prior to death. • Rationales include pre-clinical dementia and cardiovascular functioning. • Primary and secondary aging (Busse, 1969). • No difference between biological and experimental mortality.
Terminal Decline and Ergodicity In Life Satisfaction Multivariate Terminal Decline • Religious Orders Study (Wilson, et al, 2003): • Found terminal decline in episodic memory, working memory, speed, and general cognitive abilities. • Terminal decline found in virtually all individuals, but at highly variable rates. • Individual aging (Lövdén, et al, 2005): • Used cluster analysis to characterize several response profiles. • Shows terminal decline in block design, episodic memory & semantic memory as transitions through programs. • Both characterize individually varying forms of terminal decline.
Terminal Decline and Ergodicity In Life Satisfaction Non-Cognitive Decline • Terminal change in neuroticism: • Neuroticism shows long-term changes in adulthood. • These changes predict mortality (Mroczek & Spiro, 2005). • Terminal decline also noted in self-reported health & depression. • (Kaplan & Camacho, 1983; Idler & Angel, 1990; Wolinsky & Johnson, 1992; Berg, 1996). • Terminal decline in well-being: • Self-reported well being showed stronger declines over distance to death than chronological age. • Population-level change point of 4 years prior to death identified. • (Gerstorf, Ram, Röcke, Lindenberger, & Smith, 2007).
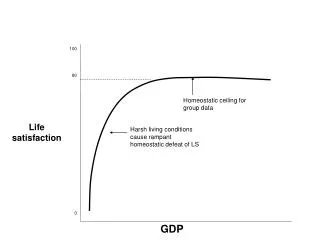
Terminal Decline and Ergodicity In Life Satisfaction Life Satisfaction • Life satisfaction is an interesting construct for terminal decline. • Life satisfaction measures are typically very stable in late adulthood • (Diener, Lucas, & Scollon, 2006; Filipp, 1996; Horley & Lavery, 1995; Kunzmann, Little, & Smith, 2000). • Well being may be both a consequence and source of successful aging. • (Bales & Baltes, 1990). • Socio-emotional selectivity theory would not terminal decline in life satisfaction. • (Carstensen, L.L., Isaacowitz, D.M., & Charles, S.T.,1999)
Terminal Decline and Ergodicity In Life Satisfaction Life Satisfaction • If terminal decline in life satisfaction is exhibited: • Supports previous studies on terminal decline in well-being. • Paves way for a gestalt view of terminal decline. • Allows for future research in cognitive-emotive links in tertiary aging. • If terminal decline in life satisfaction is not exhibited: • Supports socio-emotional selectivity theory and other theories prescribing constancy in adult personality.
Terminal Decline and Ergodicity In Life Satisfaction Life Satisfaction Data • German Socio-Economic Panel Study (SOEP). • Annual nationally-representative panel survey of German population. • Data collected annually from 1984-2005. • Participants recruited via “random walk” method. • Recruitment in 1984, 1990, 1995, 1998, 2000, 2002. • Participants approached in representative public places. • 60-70% response rate. • 4-14% attrition rate (small gifts & results for participation). • Face-to-face interviews • Mail questionnaires for 10% of multi-occasion respondents.
Terminal Decline and Ergodicity In Life Satisfaction Life Satisfaction Data • Mortality Sample • Must be 70+ at the first measurement occasion, & • Must provide mortality information (N=1637). • Age • Chronological Age • Mean = 78.20 • SD = 5.88 • Range = [70-100] • Distance-to-Death • Mean = -6.32 • SD = 4.22 • Range = [-22 to -1]
Terminal Decline and Ergodicity In Life Satisfaction Life Satisfaction Data • Life Satisfaction • “Wie zufrieden sind Sie gegenwärtig, alles in allem, mit ihrem Leben?” • “How satisfied are you with your life, all things considered?” • 0-10 Likert Scale (0=unsatisfied, 10=very satistfied). • Standardized to a T-metric on full sample. • Full Sample: Mean = 7.02, SD = 1.55. • Mortality Sample: Mean = 6.75, SD=1.57.
Terminal Decline and Ergodicity In Life Satisfaction Research Questions • Is the data better explained by chronological aging or distance-to-death? • Is there evidence of terminal change? • Are there individual differences in levels and rates of change in life satisfaction? • Are individual differences in changes in life satisfaction related to one another?
Terminal Decline and Ergodicity In Life Satisfaction Research Question 1 • Is the data better explained by chronological aging or distance-to-death? • Is there evidence of terminal change? • Compare fit of mixed effects models from life satisfaction across chronological and death ages. • Fit multiple functional forms: • Linear Mixed Effects • Quadratic Mixed Effects • Linear-Linear Spline Mixed Effects • Fixed Change Point • SAS PROC MIXED/NLMIXED
Terminal Decline and Ergodicity In Life Satisfaction Multi-Phase Mixed Effects • Alternatively, (linear-linear) spline model. • (Cudeck & Harring, 2007; Cudeck & Klebe, 2002; Willett & Singer, 2003; Wang & McArdle, in press). • Fixed Effects: LifeSat = β0+ β1*(time-β3) + ε, time< β3 LifeSat = β0+ β2*(time-β3) + ε, time> β3 • Benefits: • Better characterizes multiple change processes. • More easily interpretable than higher order parametric models. • Drawbacks: • Random change points are difficult to fit & temporarily omitted.
Terminal Decline and Ergodicity In Life Satisfaction Chronological Age Life-Satisfaction by Chronological Age, Full Sample
Terminal Decline and Ergodicity In Life Satisfaction Chronological Age Life-Satisfaction by Chronological Age, N=150
Terminal Decline and Ergodicity In Life Satisfaction Chronological Age • All models provided much improved fit over a no-change model. • All models feature (increasingly) negative slope over time. • Linear-linear spline provides the best model fit.
Terminal Decline and Ergodicity In Life Satisfaction Distance-to-Death Life-Satisfaction by Distance-to-Death, Full Sample
Terminal Decline and Ergodicity In Life Satisfaction Distance-to-Death Life-Satisfaction by Distance-to-Death, N=150
Terminal Decline and Ergodicity In Life Satisfaction Distance-to-Death • Linear-linear spline again provides the best model fit. • All distance-to-death analyses show superior fit to parallel chronological age analyses. • Evidence of declines related to distance-to-death rather than chronological age.
Terminal Decline and Ergodicity In Life Satisfaction Research Question 2 • Are there individual differences in rates of change in life satisfaction? • Are individual differences in changes in life satisfaction related to one another? • Compare fit of fixed effect and mixed models: • Linear-Linear Spline Mixed Effects • Fixed Change Point • SAS PROC NLMIXED
Terminal Decline and Ergodicity In Life Satisfaction Multi-Phase Mixed Effects • Random effects significantly improve model fit. • Log likelihood feasible because models are nested.
Terminal Decline and Ergodicity In Life Satisfaction Multi-Phase Mixed Effects Random Effects Covariance Matrix for Multi-Phase Growth Model on Distance-to-Death in Life Satisfaction *p<.001
Terminal Decline and Ergodicity In Life Satisfaction Multi-Phase Mixed Effects Y=48.14-0.64*(time), time < -4.19 Y=48.14-1.94*(time), time > -4.19
Terminal Decline and Ergodicity In Life Satisfaction Results • Distance-to-death models provided better fit than all comparable chronological age models. • Life satisfaction shows sharper decreases closer to death. • Mixed-effects models indicate individual variability in declines and relationships between level and rates of change. • No relationship between pre-terminal and terminal slopes.
Terminal Decline and Ergodicity In Life Satisfaction Random Change Points • Presented models include random effects for intercept and both linear slopes, but a fixed change point. • Random change points are notoriously difficult to estimate with standard methods. • Usually fit with SAS PROC NLMIXED. • Include First-Order Taylor Series and adaptive Gausian quadrature methods. • (Cudeck & Klebe, 2002; Cudeck & Du Toit, 2003; Hall et al., 2000). • Sensitive to initial values: • Inability to satisfy convergence criteria. • Biased point and standard error estimates
Terminal Decline and Ergodicity In Life Satisfaction Bayesian Estimation • Bayesian Estimation with Gibbs Sampling • Identical fixed effects model, random effects for all parameters. • (Wang and McArdle, in press) • Benefits: • Estimable. • Less sensitive to misspecification of starting values. • Drawbacks: • Incomparable to other types of models. • Potentially sensitive to poor priors. • Time.
Terminal Decline and Ergodicity In Life Satisfaction Random Change Points • Changes to Model • Inclusion of random change points • Appropriate additions to parameter covariance matrix • Non-informative priors • Changes to Dataset • Dataset restricted to 400 individuals with 12 or more observations. • Individuals with few occasions tended to be mischaracterized by the model, particularly with change points beyond their time series. • Population parameters do not significantly differ with this restriction.
Terminal Decline and Ergodicity In Life Satisfaction Random Change Points • Inclusion of random change points improves model fit. • While the DIC is analogous to AIC, the two cannot be directly compared, preventing direct fit comparisons between the Bayesian and Gaussian models.
Terminal Decline and Ergodicity In Life Satisfaction Random Change Point • Gaussian method is on same (restricted) sample as Bayesian models. • Use of Bayesian model results as initial values for SAS PROC Mixed did not yield convergence.
Terminal Decline and Ergodicity In Life Satisfaction Random Change Points
Terminal Decline and Ergodicity In Life Satisfaction Random Change Point • Inclusion of random change points improves model fit. • Random change point model has the lowest residual variance of any model so far. • Change points has significant variance and covariances with other parameters. • Parameters changed with the inclusion of random change points: • Terminal slope is ~.85 T-units steeper. • Change ≈ 1 unit on Likert scale every 7 years. • Alternatively, .5 units for the average decline phase. • Average change point is ~1 year closer to death.
Terminal Decline and Ergodicity In Life Satisfaction Terminal Slope Question • Why did the terminal slope decrease with the inclusion of random change points? • Misspecification problem: • Would variation in change points lead to misspecification of the terminal slope? • Ergodic problem: • What if some individuals are not undergoing linear-linear change?
Terminal Decline and Ergodicity In Life Satisfaction Misspecification Problem • How does fixing the change point affect the terminal slopes? • Misspecification of change points at the individual level should bias slope estimates. • For individuals with change points closer to death than the population (fixed) change point: • Terminal slope will be biased in the direction of the pre-terminal slope. • Pre-terminal slope estimates will be unaffected. • For individuals with change points further from death than the population (fixed) change point: • Pre-terminal slope estimates will be biased in the direction of the terminal slope. • Terminal slopes will be unaffected. • Such bias will affected fixed parameters.
Terminal Decline and Ergodicity In Life Satisfaction Misspecification Problem Intercept ~ N(109.84, 9.25) Pre-Slope ~ N(-1.019, 0.07) Post-Slope ~ N(-5.035, 1.41) Change Point ~ N(-12.44, 8.70)
Terminal Decline and Ergodicity In Life Satisfaction Misspecification Problem • Fixed change point model yields biased estimate of pre-terminal slope, terminal slope and change point. • Intercept unaffected. *true value outside of confidence interval
Terminal Decline and Ergodicity In Life Satisfaction Misspecification Problem • Both pre-terminal and terminal slopes biased. • As theorized, each biased in the direction of the other. • This created a covariance between the slopes: • rmodel = .395 • rdata = -.112. • Location of change point biased as well. • Change point closer to center of time-series (t=-15) • True= -12.43, Sampled= -12.72. • True= -15.40, Sampled= -15.37 • True= -18.30,Sampled= -17.62. • Intercept unaffected.
Terminal Decline and Ergodicity In Life Satisfaction Ergodic Problem • Assumptions of ergodicity are critical to any model, particularly mixed-effects models. • This assumption stipulates that processes occurring at the population level are representative of individuals in that population. • In our dataset, several types of ergodic problems may occur: • Classic case: some individuals aren’t characterized by spline model. • Competing risks problem: some individuals would undergo terminal change, but don’t get the chance to. • Misspecification problem (fixed change point, for example).
Terminal Decline and Ergodicity In Life Satisfaction Ergodic Problem • Evidence of ergodic problems in Life Satisfaction data: • μchange point = -3.54 • σ change point= 4.90 • Some individuals have change points outside of their time series. • Possible causes: • Some individuals are better characterized by linear change. • Artifact created by distribution specified in prior. • Carry out a final simulation, where the distribution of change points extends beyond the observed data. • Most closely mirrors the existing data. • Compare fixed and random change-point models.
Terminal Decline and Ergodicity In Life Satisfaction Ergodic Problem • Fixed change point model yields biased estimates of terminal change and change point fixed effects. • Intercept and pre-terminal slope unaffected. *true value outside of confidence interval
Terminal Decline and Ergodicity In Life Satisfaction Ergodic Problem • As predicted, terminal slopes and change points are biased. • Similarities between this simulation and observed data suggest problems found in analyses are, at least in part, artifactual. • Not definitive proof that random model is completely unbiased. • We should exercise caution in analyzing relationships between model parameters, either interrelations or relationships to covariates. • This is not a solution to more traditional ergodic problems. • Some individuals might be better characterized by continuous change. • Some spline models may capitalize on residual structures.
Terminal Decline and Ergodicity In Life Satisfaction Substantive Interpretations • Life satisfaction shows evidence of terminal decline. • All population models fit significantly better over distance to death than over chronological age. • Spline models, particularly mixed effect spline models, provided superior fit, suggesting pre-terminal and terminal decline phases. • Terminal decline in life satisfaction shows individual differences. • Intercepts, rates of change and locations of change point all show individual differences and covariances. • Models that don’t allow for individual differences, particularly in change point, show misfit and multiple patterns of bias.
Terminal Decline and Ergodicity In Life Satisfaction Substantive Issues • Violations of ergodic assumption create problems for terminal decline research. • Terminal decline faces additional issues from competing risks. • Studies of terminal decline may face an difficult problem. • Change point estimation will tend to be biased towards the center of data collection. • There is a limit to the number of observations between change point and death. • This effect is more pronounced if individuals with few occasions cannot be included. • Increasing observations typically means fewer participants, which is problematic for an individually-varying phenomenon. • Terminal change may take on a more complicated functional form that power and degrees of freedom issues may obscure.
Terminal Decline and Ergodicity In Life Satisfaction Substantive Directions • Multivariate approaches to terminal decline: • Cognitive, emotion and personality. • Cognitive-emotive links in terminal decline. • If terminal decline occurs across psychological domains, it stands to reason they may occur together. • Alternate ways of conceptualizing aging & time. • Both chronological age and distance-to-death are expressions of time in relation to an individually-varying event (birth, death). • Refinement of model: • Still characterize change from one process to another. • Create a model that functions conceptually in continuous time.
Terminal Decline and Ergodicity In Life Satisfaction Methodological Directions • Refinement of the spline model to avoid the problems detailed here. • Avoid biased parameter estimates. • Particularly, get valid estimates of change point distribution. • Create methods to distinguish between different types of change. • Sensitivity to individuals yet to undergo terminal change.
Terminal Decline and Ergodicity In Life Satisfaction Acknowledgements • Denis Gerstof, Penn State/Max Planck Institute • Nilam Ram, Penn State/Max Planck Institute • Jürgen Schupp, German Socio-Economic Panel Study • Gert G. Wagner, German Socio-Economic Panel Study • Ulman Lindenberger, Max Planck Institute • Peggy Wang, University of Virginia • Johnny Zhang, University of Virginia • John Nesselroade, University of Virginia • NIA T32 AG20500-01