Download
1 / 19
190 likes | 292 Views
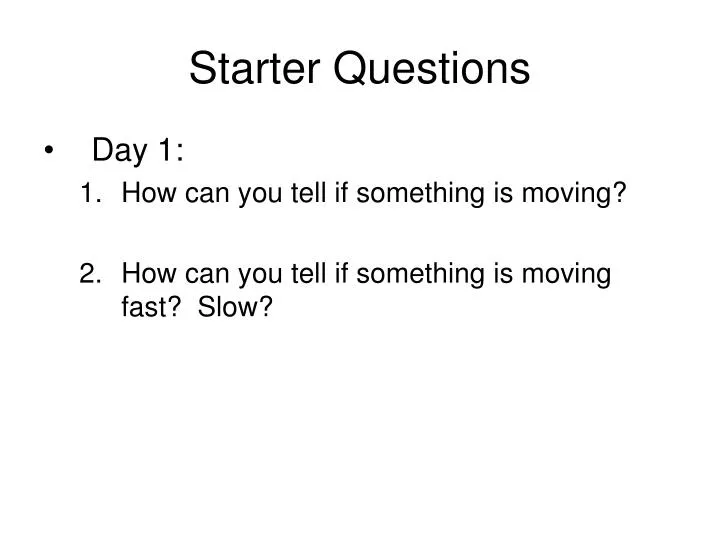
Starter Questions. Day 1: How can you tell if something is moving? How can you tell if something is moving fast? Slow?. Velocity, Speed & Motion. Welcome to Physics. Physics is the study of how Energy makes things Move .

E N D
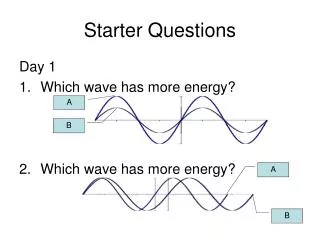
Starter Questions • Day 1: • How can you tell if something is moving? • How can you tell if something is moving fast? Slow?
Velocity, Speed & Motion Welcome to Physics
Physics is the study of how Energy makes things Move. Question: From your OBSERVATION… How do we know if something’s moving?
Physics is the study of how Energy makes things Move. Question: What variables would you need to use to determine that an object is in motion?
Physics is the study of how Energy makes things Move. Question: How would you determine if something is moving fast or slow?
Physics is the study of how Energy makes things Move. Question: How would you set up an experiment to determine if an object is moving fast or slow? How would you collect your data, and how would you show it?
Physics is the study of how Energy makes things Move. Question: How would you display your data, and how would you show it? (If you use a line graph, how would you set it up?)
Physics is the study of how Energy makes things Move. Question: How does speed influence the lines on a line graph?
Physics is the study of how Energy makes things Move. Question: How would you go about testing your hypothesis and displaying your data?
Question: How does speed influence the lines on a graph?How can you determine the speed of an object on a line graph? • Develop a hypothesis by answering the question above. • Next, create a test statement: • If your hypothesis is correct then if you change the [independent variable] the [dependent variable] should happen as a result (element of prediction). • Next, discuss how you would test your answer/hypothesis using the equipment provided. • Consider what variable you need to change. • Consider what variable you need to measure. • Consider what variables you need to keep the same. • Write up your lab procedures to test your hypothesis. • Collect your data. • Analyze your data to see if it either proves or disproves your hypothesis.
Speed • How can you tell if someone is moving fast? The Key Difference is Time Faster = more distance, less time Slower = less distance, more time Demo: Walk a fixed distance with more/less time.
“Velocity” and “Speed” Speed means distance travelled in a certain amount of time • What are two ways to increase speed? • Increase distance traveled in the same amount of time • Decrease the time it took to go the original distance Velocity is the speed in a certain direction Since they are almost the exact same thing, “Speed” and “Velocity” are used interchangeably
Graphing Velocity Graphs can help us Interpret what has actually happened! The shape of the line and steepness of the slope can tell us what has happened and how fast it occurred! That’s right! We are NOT done with graphs!!! We are only just beginning!!!
Class Activity • Lab: Velocity & Motion of a Toy Car
Interpreting Velocity on a Graph 1 2 15 m More Distance Less Time (Faster) Distance 10 m 3 5 m Less Distance More Time (Slower) 5 s 15 s 10 s Time Think of the Velocity graph this way: Which one of these balls will fall faster? The graph with more steepness is the faster velocity. The more shallow, the slower.
Constant Velocity - Slow Distance [m] 0 1 2 3 4 5 6 1 2 4 5 3 Time [Sec] Ok, so here’s the scenario: we want to see how far a car goes in 5 seconds. 3s slow 3.6m 1s slow 1.2m 2s slow 2.4m
Constant Velocity - Fast Distance [m] 0 1 2 3 4 5 6 1 2 4 5 3 Time [Sec] Now, we want to compare it to it going a bit faster. What would the graph look like? Look at how much farther it went in one second! 3s slow 1s slow 2s slow 1s fast