Download
1 / 47
490 likes | 712 Views
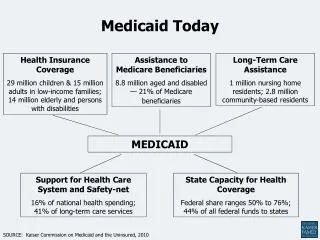
Medicaid Today. Health Insurance Coverage 29 million children & 15 million adults in low-income families; 14 million elderly and persons with disabilities. Assistance to Medicare Beneficiaries 8.8 million aged and disabled — 21% of Medicare beneficiaries. Long-Term Care Assistance

E N D
Medicaid Today Health Insurance Coverage 29 million children & 15 million adults in low-income families; 14 million elderly and persons with disabilities Assistance to Medicare Beneficiaries 8.8 million aged and disabled — 21% of Medicare beneficiaries Long-Term Care Assistance 1 million nursing home residents; 2.8 million community-based residents MEDICAID Support for Health Care System and Safety-net 16% of national health spending; 41% of long-term care services State Capacity for Health Coverage Federal share ranges 50% to 76%; 44% of all federal funds to states SOURCE: Kaiser Commission on Medicaid and the Uninsured, 2010
Medicaid Enrollees and Expendituresby Enrollment Group, 2007 Elderly 10% Elderly 25% Disabled 15% Adults 25% Disabled 42% Adults 12% Children 49% Children 20% Total = 58 million Total = $300 billion SOURCE: Kaiser Commission on Medicaid and the Uninsured and Urban Institute estimates based on 2007 MSIS and CMS64 data.
Medicaid Payments Per Enrolleeby Acute and Long-Term Care, 2007 $14,481 $12,499 Long-Term Care Acute Care $2,541 $2,135 SOURCE: Kaiser Commission on Medicaid and the Uninsured and Urban Institute estimates based on 2007 MSIS and CMS64 data.
Per Capita Spending For Medicaid Enrollees vs.Low-Income Privately-Insured Samples adjusted for health differences Adults Children SOURCE: Hadley and Holahan, “Is Health Care Spending Higher under Medicaid or Private Insurance? “ Inquiry, Winter 2003/2004.
Medicaid-To-Medicare Provider Fee Ratios for All Services NH VT WA ME MT ND MN MA OR NY SD WI ID RI MI CT WY PA NJ IA NE OH IN WV DE NV IL IL UT VA MD CO KS MO KY CA NC DC TN OK SC AR AZ NM AL GA MS TX LA AK FL HI < 70% (11 states including DC) 70-84% (7 states) 85-99% (21 states) U.S. Average = 72% of Medicare fees 100%+ (11 states) NOTE: Tennessee does not have a fee-for-service component in its Medicaid program SOURCE: S. Zuckerman, AF Williams, and KE Stockley, “Trends in Medicaid Physician Fees, 2003-2008,” Health Affairs, 28 April 2009.
Medicaid in the Health System, 2008 Medicaid as a share of national health care spending: Total National Spending (billions) $2,181 $718 $731 $138 $234 Note: Does not include spending on CHIP. SOURCE: Centers for Medicare and Medicaid Services, Office of the Actuary, National Health Statistics Group, National Health Expenditure Accounts, January 2010.
Medicaid’s Role for Selected Populations Percent with Medicaid Coverage: Families Aged & Disabled SOURCE: Kaiser Commission on Medicaid and the Uninsured and Urban Institute analysis of 2009 ASEC Supplement to the CPS; Birth data from Maternal and Child Health Update: States Increase Eligibility for Children's Health in 2007, National Governors Association, 2008; Medicare data from USDHHS.
National Spending on Nursing Home and Home Health Care, 2006 Nursing Home Care Home Health Care Total = $124.9 billion Total = $52.7 billion Note: Medicaid percentage includes spending through SCHIP. Other includes private and public funds SOURCE: Kaiser Commission on Medicaid and the Uninsured, based on Health Affairs January/February 2008, CMS, National Health Accounts.
Medicaid’s History and Purpose • Passed with Medicare, but means tested unlike Medicare • The AMA wanted to means test Medicare, and the legislation ended up with a means tested program for the non-elderly poor rather than for the elderly poor • More than just health insurance—private health insurance is typically geared toward acute care services, while Medicaid also includes coverage of long-term care services and other supportive services • Purpose is “to furnish rehabilitation and other services to help such families and individuals attain or retain capability for independent or self care” 42 U.S.C. 1396 • Statute refers to Medicaid as “medical assistance,” not “health insurance” • Includes coverage for nursing home care, home health services, durable medical equipment, prosthetic devices, transportation to doctors’ offices
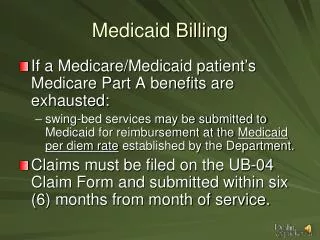
Medicaid’s History and Purpose • Safety net funding in several ways • Health care coverage for poor children and their families • Long-term care coverage for the poor (and many non-poor become poor because of long-term care costs) • “Bonus” payments to support safety net providers • Public hospitals, rural clinics, community clinics, academic medicine • Medicare gap filler • Coverage of out-of-pocket Medicare costs for the elderly poor
Medicaid Financing of Safety-Net Providers Public Hospital Net Revenues by Payer, 2008 Health Center Revenues by Payer, 2008 Total = $40 billion Total = $10.1 billion SOURCE : Data for public hospitals from America’s Public Hospitals and Health Systems,2008, National Association of Public Hospitals and Health Systems, February 2010. Health center data from 2008 Uniform Data System (UDS), Health Resources and Services Administration.
Medicaid’s Limits • Medicaid is a federal-state partnership rather than a federal-only program (unlike Medicare) • Since states have set eligibility thresholds, eligibility has varied from state to state • States also have varied in terms of optional services covered • PPACA brings more uniformity to Medicaid • As a federal-state partnership, the federal and state governments share funding, with the federal government paying a greater share for poorer states • Medicaid: 50% - 76% (Indiana – 67%) • SCHIP: 65% - 82% (Indiana – 77%) • PPACA brings more uniformity here as well
IL Medicaid Eligibility for Working Parents by Income, December 2009 NH VT WA ME MT ND MN MA OR NY ID SD WI RI MI CT WY PA NJ IA NE OH IN NV DE IL WV UT VA MD CO CA KS MO KY NC DC TN OK SC AR AZ NM AL GA MS TX LA AK FL HI < 50% FPL (17 states) 50% - 99% FPL (17 states) 100% FPL or Greater (17 states, including DC) Note: The federal poverty line (FPL) for a family of three in 2009 was $18,310 per year.SOURCE: Based on a national survey conducted by Kaiser Commission on Medicaid and the Uninsured with the Center on Budget and Policy Priorities, 2009.
Median Medicaid/CHIP Income Eligibility Thresholds, 2009 Medicaid Eligibility under Health Reform = 133%FPL Note: Medicaid income eligibility for most elderly and individuals with disabilities is based on the income threshold of Supplemental Security Income (SSI). SOURCE: Based on a national survey conducted by the Center on Budget and Policy Priorities for Kaiser Commission on Medicaid and the Uninsured, 2009.
Federal Medical Assistance Percentages (FMAP), FY 2010 NH VT WA ME MT ND MN MA OR NY ID SD WI RI MI CT WY PA NJ IA NE OH IN NV WV DE IL IL UT VA VA CO MD CA KS MO KY NC DC TN OK SC AR AZ NM AL GA MS TX LA AK FL HI 71+ percent (6 states) 62 to <71 percent (20 states including DC) 51 to 61 percent (10 states) 50 percent (15 states) SOURCE: Federal Register, February 2, 2010 (Vol. 75, No. 21), pp 5325-5328, at http://frwebgate6.access.gpo.gov/cgi-bin/PDFgate.cgi?WAISdocID=985592272797+0+2+0&WAISaction=retrieve.
PPACA and Medicaid Eligibility • Expands Medicaid to cover almost all children and non-elderly adults with incomes up to 133% FPL (really 138%) • Income is based on modified adjusted gross income (which can be higher than adjusted gross income), with a 5 percent income disregard • No asset test (under Medicaid now, family of four may not have assets more than $26,000, with exemptions for home and one, sometimes two, cars—rules relaxed in 2008) • Citizens and legal immigrants
PPACA and Medicaid Eligibility • Complexity maintained under PPACA • PPACA did not create a single new category of eligibility for all persons up to 133% of FPL • PPACA adds Subsection VIII to 42 U.S.C. §1396a(1)(2)(c), extending Medicaid eligibility by creating a new category for those with incomes up to 133% FPL who are • Under 65 • Not Medicare eligible • Not pregnant • Not in any in existing “mandatory categorical needy” group • New eligibles receive “benchmark coverage,” which is like traditional health care coverage
PPACA and Medicaid Reform • People who lose Medicaid eligibility because of increased income no longer have to worry about becoming uninsured • When their income exceeds 133% of FPL (plus the 5% disregard), they will shift to the exchanges and receive generous subsidies • SCHIP will be phased out • Children in families between 100-133% FPL will receive their coverage through Medicaid • Higher income children will be eligible for health care exchange subsidies • SCHIP continues until 2019 to allow time for the health exchanges to become operational
Premium Assistance Credit • Premium assistance credit equals cost of silver policy less amount taxpayer expected to pay for insurance. This runs between 2% to 9.5%, indexed. • E.g., if income for a family of 4 about $30,000 and cost of policy is $10,000, then family should pay 3% of income towards cost or $900. Credit is $9,100. • Same but family has income of $88,000. Here family pays 9.5% of income or $8,360 and credit is $1,640.
Why Keep Medicaid? • Medicaid costs less than private insurance • Lower per person costs • Lower administrative costs • 5% in Medicaid • Ability to set rates for managed care plans provides more predictability than exchange subsidy costs and allows the government to exploit its market power • Existing, specialized systems of care that work • Safety net providers • Public hospitals, rural clinics • Community health centers, in particular • Medicaid managed care organizations (MCOs) • Reduced ER and hospital use • But poor may be better off in same system as wealthier persons
New Financing, Easier Enrollment • Medicaid’s federal-state sharing of costs becomes more favorable for states • New PPACA eligibles: feds pay 100% for 3 years, 95%, 94%, 93%, 90% thereafter • Old eligibles: old state match • 50% - 75% (Indiana – 67%) • Helps neutralize 10th Amendment argument • Preventing states from gaming the system • Maintenance of effort requirements—States cannot cut back their coverage rules to make more people eligible for the enhanced federal match • New simplified enrollment procedures • Single, streamlined form states may use • Enrollment online or by mail, phone, or in person • Uniform income rules and no asset rules • Electronic data matching
Addressing Provider Shortages • Medicaid may provide coverage, but beneficiaries may have trouble finding a doctor who will accept payment from Medicaid • PPACA increases funding for • Primary care physicians (payment at Medicare rates for two years) • Community Health Clinics • School based and nurse managed clinics • Training health care and public health professionals • With focus on primary care physicians who will practice in underserved areas • Redistributes Disproportionate Share Hospital (DSH) funds, favoring states with the highest percentage of uninsured
Medicare Spending as a Share of Total Federal Outlays, FY2010 2010 Total Outlays = $3.5 trillion SOURCE: OMB, Fiscal Year 2010 Budget, February 2009. Budget Summary by Category.
Distribution of Total Medicare Beneficiaries and Spending, 2005 Average per capita Medicare spending among top 10%: $44,220 Average per capita Medicare spending among bottom 90%: $2,934 Total Number of Beneficiaries, 2005: 37.5 million Total MedicareSpending, 2005: $265 billion NOTE: Analysis excludes Medicare Advantage enrollees. SOURCE: Kaiser Family Foundation analysis of the CMS Medicare Current Beneficiary Survey Cost & Use file, 2005.
Estimated Sources of Medicare Revenue, 2010 TOTAL $499 Billion PART A $237 Billion PART B $196 Billion PART D $66 Billion SOURCE: 2009 Annual Report of the Boards of Trustees of the Federal Hospital Insurance and Federal Supplementary Medical Insurance Trust Funds.
Median Out-of-Pocket Health Care Spending As a Percentage of Income AmongMedicare Beneficiaries, 1997–2005 Total health care out of pocket Premium out of pocket Nonpremium out of pocket NOTE: Annual amounts for the components of total health care spending do not sum to total amounts because values shown are median, not mean, values. SOURCE: Kaiser Family Foundation analysis of CMS Medicare Current Beneficiary Survey Cost and Use files, 1997-2005.
Medicare is less generous than FEHB and other large employer plans Share of Total Spending Paid by Plan in 2007 Total Average Medical Spending = $14,270 NOTE: The FEHBP (Federal Employees Health Benefits Program) standard option is offered through Blue Cross Blue Shield. Employer plans include dental benefits. SOURCE: Hewitt Associates analysis for the Kaiser Family Foundation, 2008.
Medicare Beneficiaries and The Number of Workers Per Beneficiary Millions SOURCE: Kaiser Family Foundation based on the 2009 Annual Report of the Boards of Trustees of the Federal Hospital Insurance and Federal Supplementary Medical Insurance Trust Funds.
Community Hospital Payment-to-Cost Ratios, by Source of Revenue, 1980-2008 Note: Payment-to-cost ratios show the degree to which payments from each payer cover the costs of treating its patients. They cannot be used to compare payment levels across payers, however, because the service mix and intensity vary. Data are for community hospitals. Medicaid includes Medicaid Disproportionate Share payments. Source: American Hospital Association and Avalere Health, Avalere Health analysis of 2008 American Hospital Association Annual Survey data, for community hospitals, Trendwatch Chartbook 2010, Trends Affecting Hospitals and Health Systems, Table 4.4, p. A-35, at http://www.aha.org/aha/trendwatch/chartbook/2010/appendix4.pdf.
Per Enrollee Growth in Medicare Spending and Private Health Insurance Premiums (for Common Benefits), 1970-2008 Notes: Per enrollee includes primary policy-holder plus dependents. Common benefits include hospital services, physician and clinical services, other professional services, and durable medical products; they exclude, for example, prescription drugs, home health care, non-durable medical products, and nursing home care. Source: Centers for Medicare and Medicaid Services, Office of the Actuary, National Health Statistics Group, Table 13, at http://www.cms.hhs.gov/NationalHealthExpendData/downloads/tables.pdf.
New Medicare Spending • But PPACA also cuts Medicare spending. Hence, it is not so popular among seniors
Permanent reductions in Medicare reimbursement rates (§ 3401) • Applies to hospitals, nursing homes and other facilities • Every year, payment rates are adjusted to reflect increases in the operating costs of health care facilities • The increases have been calculated from a “market basket” of goods and services that the facilities purchase (with reductions for failure to file quality data and other “technical” adjustments) • Under PPACA, a productivity adjustment will be made based on economy-wide productivity gains (which are greater than in health care)—there also will be a ten-year further reduction in the update percentage (0.10 to 0.75 percent per year) • Estimated savings = $196 billion
Permanent reductions in Medicare reimbursement rates (§ 3401) • Note that PPACA provisions reflect a mix of policy and politics—see the annual reductions in update percentages: 2010 0.25% 2015 0.20% 2011 0.25% 2016 0.20% 2012 0.10% 2017 0.75% 2013 0.10% 2018 0.75% 2014 0.30% 2019 0.75% • After 2019, IMAB recommendations due to kick in
Reduction in payment rates forMedicare Advantage program (§ 3201) Medicare Advantage is an option for Medicare recipients to enroll in a private health care plan rather than choosing traditional, fee-for-service Medicare (Part C of Medicare) While the idea was to provide a more-efficient, lower-cost option, Medicare Advantage plans have turned out to be more expensive (up to 150% of traditional Medicare) The low-hanging fruit of cost savings Estimated savings = $135 billion
Medicare Advantage Payments Relative to Traditional Fee-for-Service Medicare, 2009 100% Traditional Fee-for-Service Medicare Medicare Advantage Plan Types NOTE: HMO is health maintenance organization; PPO is preferred provider organization.SOURCE: Medicare Payment Advisory Commission, December 2008.
Part B Medicare premium calculation for high-income recipients (§ 3402) • Part B of Medicare covers physician fees, laboratory fees and other outpatient services • Most Medicare recipients pay 25 percent of the Part B premium; currently, higher income recipients pay between 35 and 80 percent of the Part B premium. • PPACA freezes the income thresholds for higher-income premiums at 2010 levels for ten years before resuming annual adjustments for inflation. • Estimated savings = $25 billion
Reduction in disproportionate share hospital (DSH) payments (§ 3133 ) • DSH payments are made to hospitals that treat a disproportionate share of low-income patients • Originally introduced to compensate hospitals for higher costs of treating low-income patients; now justified as a way to maintain access to care for low-income patients • Estimated savings = $22 billion
Independent Payment Advisory Board (IPAB) (§ 3403) • IPAB will develop proposals to keep Medicare spending within statutory targets, and proposals will automatically take effect unless Congress adopts substitute provisions • Proposals may not ration health care, raise costs to recipients, restrict benefits or modify eligibility criteria • IPAB also will provide Congress with recommendations for slowing the growth of health care spending in the private sector. • Estimated savings = $16 billion by 2020, more substantial after that (assuming it works)
Independent Payment Advisory Board (IPAB) (§ 3403) • Concerns about IPAB • Will IPAB focus on short-term fixes rather than long-term changes that really can “bend the cost curve?” • Will Congress bypass the IPAB process and authorize increases in funding through independent legislation? • Are the limitations on the kinds of proposals that IPAB can develop too restrictive? • Will cuts in reimbursement reduce patient access to physicians?
Patient-Centered OutcomesResearch Institute (§ 6301) • Created to promote comparative-effectiveness research (CER) • Research that evaluates and compares the patient health outcomes and benefits of two or more medical treatments or services • Responsibilities include • Setting priorities for CER and funding CER studies • Analyzing data from CER studies and reporting to the public on the significance of the study results
Patient-Centered OutcomesResearch Institute (§ 6301) • The Institute may not recommend coverage changes or other policies based on its analyses, but • Medicare and Medicaid may consider the Institute’s analyses in determining coverage policies as long as: • No denial of coverage “solely on the basis of” CER • Coverage decisions do not treat the lives of elderly, disabled or terminally ill individuals as having lower value
Can the CER institute become our NICE? • NICE evaluates the cost-effectiveness of medical therapies and approves those that are sufficiently cost-effective for Britain’s National Health Service • Treatments are cost-effective if they provide 1 QALY for no more than £20,000 (now $31,250) • Sometime, NICE approves treatments up to £30,000 ($46,900) per QALY • Rarely, NICE approves treatments beyond £30,000 per QALY • NICE has approval authority, while the CER institute can only issue reports • CER institute “shall not develop or employ a dollars-per-quality adjusted life year . . . as a threshold” nor shall HHS employ such a measure as a threshold for coverage.
Can we make QALY-based decisions? • Cost-effectiveness decisions are controversial • Prohibited under PPACA from being used as sole basis for denying coverage in federal programs (§6301) • Oregon Health Care Plan • Ended up with fairly generous “basic” coverage • Mammography screening guidelines in 2009 (even though cost wasn’t a factor) • US Preventive Services Task Force recommended that routine screening begin at age 50 instead of age 40 • The “tragic choices” problem • It’s difficult to make life-and-death decisions openly
PPACA demonstration projects • Bundled payments for hospital care and for the month following discharge (capitation lite) (§2704 and §3023) • Capitation payments instead of fee-for-service reimbursement (§2705) • Incentives for doctors and hospitals to form accountable care organizations (financial rewards for higher quality and/or lower cost care) (§2706 and §3022) • Will integrated systems exploit market power to maintain revenues rather than to introduce efficiencies and reduce costs?
Quality-adjusted payments under PPACA • Incentive payments to hospitals that meet specified performance standards (§3001) • Adjustments to physician reimbursement based on quality and cost of care provided (§3001) • Expansion of reports to physicians that indicate how their use of resources in patient care compares to use by other physicians (§3003) • Lower payments to hospitals with high numbers of patients who become sicker because of their hospital care (§3008) • Lower payments to hospitals that have excessive numbers of patients readmitted to the hospital after discharge (§3025)
Quality-adjusted payments • Pay for performance so far has a mixed track record • It’s difficult to assess quality of care—did a patient do well because of or despite the doctor’s intervention? • Often, process-based measures are used, but those need continual updating • Impact has been modest to date