Download
1 / 1
20 likes | 170 Views
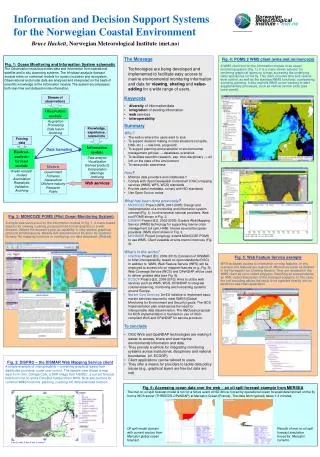
Norwegian Meteorological Institute - met.no. Web services. Fig. 1: Ocean Monitoring and Information System schematic

E N D
NorwegianMeteorologicalInstitute - met.no Web services Fig. 1: Ocean Monitoring and Information System schematic The Observation module provides data and information from operational satellite and in situ observing systems. The Hindcast-analysis-forecast module relies on numerical models for ocean circulation and ecosystem. Observational and model data are analyzed and interpreted on the basis of scientific knowledge in the Information module. The system encompasses both real-time and delayed mode information. Stream of observations Observation module AcquisitionProcessingData fusionArchiving Knowledge,experience,related info Forcing data Information module Hindcast-analysis-forecast module Data transfers Data analysis VisualizationDerived productsInterpretation Warnings Archiving Users Ocean-ecosyst. models Assimilation ReanalysisValidation Archiving GovernmentFisheriesAquacultureOffshore industryResearchPublic Fig. 4: POMS 2 WMS client (wms.met.no/moncoze) A WMS client tool for the Information module in an ocean monitoring system (Fig. 1). It is a menu-driven selector for rendering graphical layers on a map, accessing the underlying data repositories on the fly. This client includes time and vertical level control, as well as the standard WMS functions: overlayering, zooming, panning. It also exploits WMS cursor tracking to start supplementary processes, such as vertical section plots (see lower panel). Fig. 2: MONCOZE POMS (Pilot Ocean Monitoring System) A simple web service tool for the Information module in Fig. 1. A menu-based selector for viewing routinely produced fixed-format graphics in a web browser. Utilized the browser’s pop-up capability to view several graphical products simultaneously. Weekly text assessment of situation for southern Norway. No mapping functions or overlaying, nor data download. (Retired) Fig. 3: DISPRO – the DISMAR Web Mapping Service client A simple example of interoperability – combining graphical layers from distributed providers, under user control. The sample view shows a map layer from Univ. College Cork, a SAR image from NERSC, a current forecast field from met.no and a FerryBox transect from NIVA. Note also buttons for common WMS functions: panning, zooming. No data download function. Fig. 6: Accessing ocean data over the web – an oil spill forecast example from MERSEA The met.no oil spill forecast model is run for a fictive event off SE Africa, forced by operational ocean forecast data fetched on the fly from a WCS server (THREDDS-OPeNDAP) at Mercator-Ocean (France). The data fetch typically takes 1-3 minutes. Oil spill model domain with current vectors from Mercator global ocean forecast. Results of met.no oil spill forecast simulation forced by Mercator currents. Information and Decision Support Systems for the Norwegian Coastal Environment Bruce Hackett, Norwegian Meteorological Institute (met.no) • The Message • Technologies are being developed and implemented to facilitate easy access to marine environmental monitoring information and data for viewing, sharing and value-adding for a wide range of users. • Keywords • diversity of information/data • integration of existing information • web services • interoperability • Summary • Why? • The web is where the users want to look • To support decision making in crisis situations (oil spills, HAB, etc.) → real-time, prognostic • To support planning and evaluation of environmental management policies → databases, scenarios • To facilitate scientific research, esp. inter-disciplinary → all info on the state of the environment • To raise public awareness • How? • Mobilize data providers and collaborate !! • Comply with Open Geospatial Consortium (OGC) mapping services (WMS, WFS, WCS) standards • Provide useful metadata, comply with ISO standards • Use Open Source codes • What has been done previously? • MONCOZE Project (NFR, 2001-2005): Design and implementation of a monitoring and information system concept (Fig. 1). Involve several national providers. Web tool POMS shown in Fig. 2. • DISMAR Project (EU, 2002-2005): Explore Web Mapping Service (WMS) technology for supporting marine crisis management (oil spill, HAB). Involve several European providers. WMS client shown in Fig. 3. • MONBASE Project (ongoing): extend MONCOZE POMS to use WMS. Client viewable at wms.met.no/moncoze (Fig. 4). • What’s in the works? • InterRisk Project (EU, 2006-2010): Extension of DISMAR to fuller interoperability, based on open standards (OGC). In addition to WMS, Web Feature Service (WFS) will be employed to access info on mapped features (e.g., Fig. 5); Web Coverage Service (WCS) and OPeNDAP will be used to deliver gridded data (see Fig. 6). • ECOOP Project (EU, 2006-2010): Aims to utilize web services such as WMS, WCS, OPeNDAP to integrate coastal observing, monitoring and forecasting systems around Europe. • Marine Core Services: An EU initiative to implement basic marine services required to meet GMES (Global Monitoring for Environment and Security) goals. The MCS Implementation plan emphasizes the need for interoperable data dissemination. The MyOcean proposal for MCS implementation is founded on use of OGC-compliant WxS and OPeNDAP for service provision. • To conclude • OGC WxS and OpeNDAP technologies are making it easier to access, share and view marine environmental information and data. • They provide a vehicle for integrating monitoring systems across institutional, disciplinary and national boundaries. (cf. ECOOP) • Client applications can be tailored to users. • They offer a means for providers to tackle data policy issues (e.g., graphical layers are free but data are not) Fig. 5: Web Feature Service example WFS facilitates access to information on map features. In this example, the features are regions of different ice types as defined in the Norwegian Ice Charting Service. They are rendered in the WMS client as color-coded polygons. Selecting an area produces an XML-coded description of the impinged polygons. In this case, the xml-encoding allows the result to be ingested directly into an electronic sea chart application.