Download
1 / 18
180 likes | 303 Views
OSNAP: Overturning in the Subpolar North Atlantic . Susan Lozier Earth and Ocean Sciences Duke University Irminger Sea Workshop • 12.17.2013. OSNAP International Partners U.S. : Susan Lozier (Duke); Bill Johns (U. Miami); Amy Bower, Bob Pickart and Fiamma Straneo (WHOI)

E N D
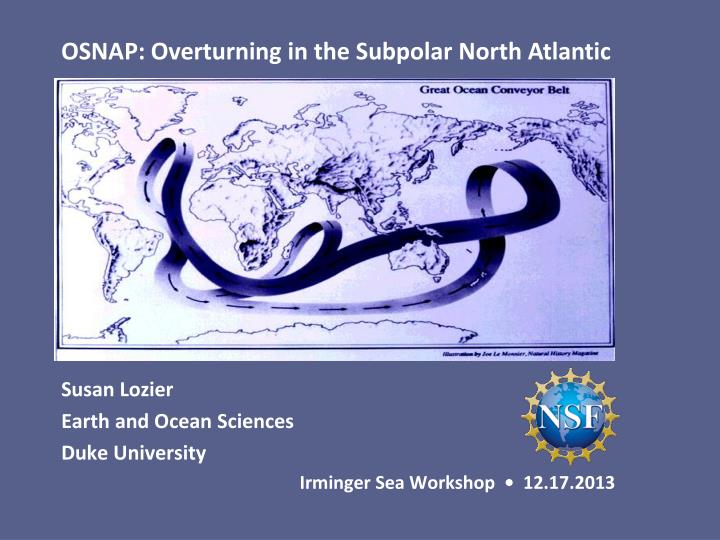
OSNAP: Overturning in the Subpolar North Atlantic Susan Lozier Earth and Ocean Sciences Duke University Irminger Sea Workshop • 12.17.2013
OSNAP International Partners U.S. : Susan Lozier (Duke); Bill Johns (U. Miami); Amy Bower, Bob Pickart and Fiamma Straneo (WHOI) UK: Sheldon Bacon, Penny Holliday and Chris Wilson (NOC); Stuart Cunningham and Mark Inall (SAMS); David Marshall and Helen Johnson (Oxford) and Ric Williams (Liverpool) Netherlands: Laura de Steur (NIOZ) Germany: Jürgen Fischer, Johannes Karstensen and Martin Visbeck (GEOMAR) and Torsten Kanzow (AWI) Canada: Blair Greenan (BIO); Brad de Young (Memorial U.) France: Herlé Mercier and the OVIDE group; Virginie Thierry (IFREMER)
OSNAP overall goal: To quantify the large-scale, low-frequency, full water-column net fluxes of mass, heat and fresh water associated with the meridional overturning circulation in the subpolar North Atlantic. • German 53°N western boundary array and Canadian shelfbreak array; • US West Greenland boundary array; • US/UK East Greenland boundary array; • Netherlands western Mid-Atlantic Ridge array; • US eastern Mid-Atlantic Ridge array; • UK survey over the Hatton-Rockall Bank and Rockall Trough; • UK Scottish Slope current array. • Red dots: US float launch sites. • Blue star: US OOI Irminger Sea global node. • Black concentric circles: US sound sources.
The specific OSNAP objectives are to: 1. Quantify the subpolar AMOC and its intra-seasonal to interannual variability via overturning metrics, including associated fluxes of heat and freshwater. 2. Determine the pathways of overflow waters in the NASPG to investigate the connectivity of the deep boundary current system. 3. Relate AMOC variability to deep water mass variability and basin-scale wind forcing. 4. Determine the nature and degree of the subpolar-subtropical AMOC connectivity. 5. Determine from new OSNAP measurements the configuration of an optimally efficient long-term AMOC monitoring system in the NASPG.
OSNAP West OSNAP East OSNAP array: Mooring locations (vertical lines) and glider domain (shaded box). Velocities will be directly measured at boundaries and flanks of Reykjanes Ridge. T/S sensors and gliders will be used to estimate the interior geostrophic velocities. Black moorings indicate where the velocity field is directly sampled. Gray moorings double as direct velocity measures and endpoints for the geostrophic regions. Salinity (psu) Lab Sea Hatton/Rockall Irminger Sea Iceland basin
OSSE runs for the OSNAP observing system OSNAP East; r=.85 Overturning in density coordinates. The overturning metric is the maximum minus minimum depth-integrated value for the basin-integrated volume fluxes for each 30-day period. Red: Model truth Black: OSSE OSNAP West; r=.95
The primary interdisciplinary linkages for OSNAP are with biogeochemistry, ocean biology and the cryosphere. Linkage is predicated on three main questions: a. What are the mechanisms controlling CO2 uptake in the subpolar North Atlantic and how do they vary on seasonal and interannual time scales? To what extent does ocean physics, particularly the AMOC, constrain this uptake? • What are the spatial and temporal patterns of primary productivity in the North Atlantic on seasonal and interannual time scales? To what extent does ocean physics, including AMOC variability, constrain the productivity? c. What is the linkage between poleward heat transport in the subpolar basin and Arctic sea-ice reduction? Mass loss from the Greenland Ice Sheet?
OSNAP Timeline OSNAP PI meeting: Ocean Sciences Meeting, February 2014 In the water: Summer 2014 1. Sound source deployment: Bower 16 Jun 14 Woods Hole 30 Jun 14 Reykjavik 2. OSNAP East moorings: Johns, de Steur, Cunningham 04 Jul 14 Reykjavik 30 Jul 14 Reykjavik 3. Greenland OSNAP moorings: Pickart, Straneo, Bacon 03 Aug 14 Reykjavik 31 Aug 14 Reykjavik
OSNAP East: Irminger basin Climatological potential temperature across the Irminger Basin with absolute geostrophic velocity (perpendicular to section from Våge et al. 2011) overlaid. Proposed Irminger basin array includes (west to east): 7 WHOI moorings (red; 5 shown, the other two are farther in on the shelf), 5 UK/SOC (green), 1 profiling and 1 flanking OOI mooring (magenta) and 4 NIOZ moorings (blue). Black squares show T/S and current meter pairs, triangles ADCPs. OOI profiling mooring includes a subsurface profiler and an upper winched profiler.
OSNAP East: Iceland basin Proposed Iceland Basin mooring array, superimposed on salinity from the 1991 Dutch AR7E section (van Aken and de Boer 1995). Density contours (σθin kg/m3) are in black. At left is the Reykjanes Ridge crest; at right is Hatton Bank. Hatched area near Hatton Bank indicates the coverage of the UK glider program. ISOW, relatively high-salinity water underlying the relatively fresh LSW at intermediate depths, can be seen hugging the deep eastern slope of the Reykjanes Ridge.
Modified UK design for eastern OSNAP East Schematic of the updated OSNAP eastern boundary array described in the UK proposal. Shading is the 15-year mean section normal velocity from the model used for the OSNAP OSSEs (positive northward; zero isotach at bold contour). Thin contours are potential density in kg/m3. Mooring M4 is the US Iceland Basin end-point mooring. A UK glider will patrol the Hatton Bank/Hatton-Rockall Basin (dashed zig-zag line). The Rockall Trough array consists of five UK moorings: 1. RTWB1 & RTEB1 are end-point density moorings measuring the baroclinic circulation across the width of the trough using CTDs distributed in the vertical; 2. RTWB1 & RTWB2 measure the Feni Ridge current using current meters; 3. RTEB1, RTADCP1 & RTADCP2 measure the Shelf Edge Current using current meters and 75khz long-ranger acoustic Doppler current profilers (range ca. 650-800m). RTEB1 includes a bottom pressure recorder to determine the trans-subpolar gyre connections from Scotland to Greenland to Newfoundland. The Rockall Trough section will also be surveyed up to 10 times per year as the glider transits to and from Hatton Bank at the beginning and end of each 4-monthly glider mission.
OSNAP West: Labrador basin (Left) Mooring array across the eastern boundary of the Labrador Sea overlaid on a synoptic salinity (psu) section. Each square denotes a current meter and Microcat. The current meters are a mix of Aquadopps and upward-facing ADCPs. The three shoreward-most moorings are shelf-tripods with a tethered weak-link ICECAT. The seaward-most mooring contains a moored profiler (MMP) sampling between the discrete instruments. (Right) Mooring array overlaid on corresponding section of absolute geostrophic velocity (positive is poleward flow).
Climatological mean salinity (psu) from HydroBase, showing that the high-salinity ISO cores occupy approximately the same depth range on both flanks of the Reykjanes Ridge. Overlaid boxes indicate where RAFOS floats will be released at each site. Synoptic potential temperature sections from both sides of Cape Farewell, showing low-temperature DSO (from Holliday et al. 2009). Overlaid boxes indicate where RAFOS floats will be released at each site. The boxes enclose the high-velocity boundary current cores (not shown) determined from Våge et al. (2011a) and from OVIDE observations (P. Lherminier, personal communication).
Table 1: OSNAP East OSSE correlations (r) and root mean squared deviations (RMSD) from the US proposal (Old) and the updated design (New) compared to the model “truth” reference case (Ref.). All time series were smoothed with a 3-month boxcar filter.
Table 1. Cruise responsibilities by country. Colors indicate individual cruises. If not specified, “moorings" includes current meter/microcat, dynamic height and sound source (SS) moorings. Key: Cruise responsibilities by country. Colors indicate individual cruises. If not specified, “moorings" includes current meter/microcat, dynamic height and sound source (SS) moorings. ORIGINAL SHIP SCHEDULE (in US OSNAP East and West August 2012 NSF proposals) Proposed SCHEDULE July 2013
Items to discuss: 1. NAVIS: North Atlantic Virtual Institute 2. Student exchanges 3. OSNAP website 4. Communication 5. Planning meetings; virtual meetings 6. Data sharing; data format 7. Ship scheduling 8. OSNAP linkages
Summary • OSNAP addresses a high priority of the U.S. AMOC program, which was developed to meet 1 of 4 near-term priorities of the 2007 ORPP. • OSNAP will enable answers to fundamental questions regarding ocean overturning. • OSNAP leverages existing measurement systems; interface w/ OOI. • OSNAP has garnered significant international interest and collaboration. • OSNAP is a multi-disciplinary observing program that will investigate physical constraints on biogeochemistry, marine ecosystems and the cryosphere.