Download
1 / 26
260 likes | 388 Views
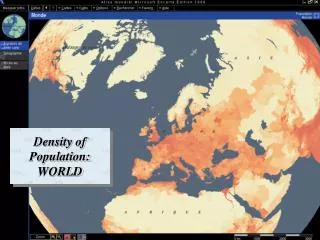
POPULATION DENSITY BASED ON Geographi -cal AREA of india. Kashmir. Rajasthan. South India. Kerala. The population density of India has gone up to 382 persons per square kilometre in 2011 from 325 persons per square kilometre in 2001. Density of population.

E N D
Kashmir Rajasthan South India Kerala
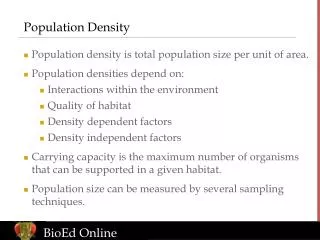
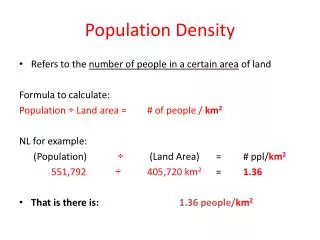
The population density of India has gone up to 382 persons per square kilometre in 2011 from 325 persons per square kilometre in 2001. Density of population ‘Density of Population’ is defined as the number of persons per square kilometre. It is an important index of population which shows concentration of population in a particular area. As per the provisional population totals of Census 2011, the population density of India has gone up to 382 persons per square kilometre from 325 persons per square kilometre in 2001. On an average, 57 more people inhabit every square kilometre in the country as compared to a decade ago.
Note 1. For working out density of India, the entire area and population of those portions of Jammu & Kashmir which are under illegal occupation of Pakistan and China have not been taken into account. India accounts for a meagre 2.4 percent of the world surface area of 135.79 million square kms. On the other hand, it supports and sustains 17.5 per cent of the world population. In contrast, the USA accounts for 7.2 per cent of the surface area with only 4.5 per cent of the world population. As such, among the ten most populous countries of the world, only Bangladesh has a higher population density compared to India. The population density of India from 1901 to 2011 is shown in Statement 31.At the beginning of the twentieth century i.e. in 1901 the density of India was as low as 77 persons per sq. km. this steadily increased in each decade to reach382 persons per sq. km. in 2011. This constitutes a 17.5 per cent increase over 2001.
Note 1 While working out the density of India, Jammu & Kashmir has been excluded as comparable figures of area and Population are not available for that State. Density of population, India: 1901-2011
Note 2 The density has been worked out on comparable data.
The rate of increase in density of India has exhibited a sharp decline during 2001-2011 (17.5 per cent) as compared to 1991-2001 (21.7 per cent). Density of Population While the absolute increase is indeed a matter of concern, the positive feature is that the rate of increase has slowed down and has shown a sharp decline in the last decade. High increase in the density of population is a matter of great concern as it puts immense pressure on our natural resources and existing infrastructural facilities and adversely affects the quality of life. “Pressures resulting from unrestrained population growth put demands on the natural world that can overwhelm any efforts to achieve a sustainable future. If we are to halt the destruction of our environment, we must accept limits to that growth.”1
Source 1 World Scientist’s Warning to Humanity, signed by 1600 senior scientists from 70 countries (including 102 Nobel Prize laureates), http://www.worldpopulationbalance.org/ quotes accessed on 27th March 2011 POPULATION DENSITY OF STATES AND UNION TERRITORIES The States and Union Territories of our country vary widely in terms of their density due to differences in climatic conditions, geo-physical characteristics, availability of resources etc. It is, therefore, essential to analyse the variations across the States/UTs. Statement 32 depicts rankings of States/UTs of India in descending order of their densities in 2011 and corresponding rankings in 2001.
Note While working out the density figures for Jammu & Kashmir for 2001and 2011 censuses, the entire area and population of those portions of Jammu & Kashmir which are under illegal occupation of Pakistan and China have not been taken into account. Ranking of States and Union Territories by density: 2001 and 2011
Amongst States, Bihar has become the most densely populated State with 1102 persons/km2 and Arunachal Pradesh the least densely populated State with 17 persons/km2 in 2011 RANKING OF STATES A better analysis would be possible if the States and Union Territories are segregated. The following Statement gives the comparative ranking of States in 2011 and 2001: The Statement given above reveals that the rest two States have interchanged their places. Bihar is at the top pushing West Bengal to second rank. Kerala and Uttar Pradesh have retained their rankings of third and fourth respectively. Haryana on the other hand has advanced by two ranks from Rank 7 to Rank 5 replacing Punjab which has fallen by two ranks from 5 to 7. Jharkhand, similarly has risen by two places from Rank 10 to 8 replacing Goa which has declined from Rank 8 to 10. Karnataka has moved up by one place while Andhra Pradesh has fallen by one place from 13 to 14. Meghalaya has moved up by 2 ranks; Jammu & Kashmir has moved up by 3 ranks; Himachal Pradesh dropped by 1 rank; Nagaland dropped by 4 ranks. Other states namely, Tamil Nadu, Assam, Maharashtra, Tripura, Gujarat, Orissa, Madhya Pradesh, Rajasthan, Uttarakhand, Chhattisgarh, Manipur, Sikkim, Mizoram and Arunachal Pradesh have retained their rankings.
NCT of Delhi continues to head the UTs, while Andaman & Nicobar Islands brings up the rear. RANKING OF UNION TERRITORIES The following Statement gives the comparative ranking of UTs in 2011 and 2001: The ranking of UTs as per Population Density remains by and large the same with the exception of Daman & Diu and Lakshadweep who have exchanged places with each other. NCT of Delhi continues to head the UTs, while Andaman & Nicobar Islands brings up the rear.
POPULATION DENSITY BY GEOGRAPHICAL REGIONS An attempt has been made to analyse the differentials in population densities across the six regions in the country. Statement 35 gives the States/ Uts included in different regions and densities of each of the regions.
Population density in different regions, States and Union Territories:2001 and 2011
Notes 1 While working out the density of India, Jammu & Kashmir has been excluded as comparable figures of area and Population are not available for that State. 2 The density has been worked out on comparable data. Population density in different regions, States and Union Territories:2001 and 2011 It may be seen that the Eastern region has the highest density of 625 persons per sq. Km. and the North Eastern region has the lowest density of 176 persons per sq. Km. Central region occupies the second highest place in density with 417 followed by Southern region (397), Western region (344) and Northern region (267) respectively. Over the period 2001-2011, the density in the Central region (20.31%), Northern region (19.48%) and Eastern region (18.98%) has gone up at a higher pace than that of Western region (17.18%), North-Eastern region (17%) and Southern region (12.58%).
Eastern region has the highest density of 625 persons per sq. km. and the North Eastern region has the lowest density of 176 persons per sq. km. This is consistent with what historical demographers have noted, “The Gangetic plain has constituted the sub-continent’s demographic heartland for over two millennia, and will remain so during the foreseeable future. The North-South demographic divide is also of long standing”.2 Density of population impacts the environment and ultimately quality of life of the people. Increasing pressures of population has already impacted the way people live and how they are governed. Reducing the load on the natural resources and infrastructure especially in the urban areas would remain a huge challenge for administrators and policy makers.
Density of Population, India, States and Union Territories: 2001
Density of Population, India, States and Union Territories: 2011
PRESENTATION PREPARED BY AAKRITI AGGARWAL STUDENT OF CLASS 9-D ROLL NO.-1