Download
1 / 14
140 likes | 231 Views
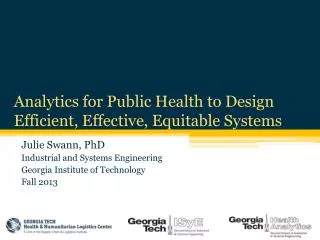
Analytics for Public Health to Design Efficient, Effective, Equitable Systems. Julie Swann, PhD Industrial and Systems Engineering Georgia Institute of Technology Fall 2013. Health Analytics. What is it?

E N D
Analytics for Public Health to Design Efficient, Effective, Equitable Systems Julie Swann, PhD Industrial and Systems Engineering Georgia Institute of Technology Fall 2013
Health Analytics • What is it? • A set of methods from the mathematical, engineering, physical, and social sciences to understand, predict, optimize, and/or evaluatea system using real or generated data. (Can include Biosurveillance) • What types of tools? • Statistics and probability • Optimization with mathematical modeling • Simulation of systems with uncertainty • Economics and financial analysis • What goals? • Efficiency (cost) • Effectiveness (outcomes) • Equity (disparities)
Research Examples • Population screening policies for diseases • Hepatitis C, HIV, Cancers, Newborn Screening • Who? What ages? How often? • Interventions for diseases spreading across a network • H1N1a pandemic using agent-based modeling • Post-campaign evaluation of distribution system • Quantifying and explaining access to care and disparities • Pediatric patients across a network • Predicting disease prevalence in small areas • Childhood obesity • Decision-support tools • Catch-up scheduling for vaccinations • Work covers multiple disciplines at GT including collaborations with CDC and other health entities, representing many researchers not present today
Population Screening • Screening to diagnose disease can • Increase treatment success or slow disease • Reduce secondary infections • Trade-offs • May be costly to test many people • Test or overtreatment may involve some risk • Research Question: • Who should be screened and how often, given their risk characteristics and the specifics of the disease? • Simulation can be used to examine screening policies across a population for the current and future cost and outcomes • “Natural History” of a disease populated with clinical findings on progression, rates, etc. • Approach has been used for cancers, HIV, Hepatitis C, newborn screening, etc.
Community 1 Household 2 Household 1 School Work place Household4 Household 3 Community 2 Disease Epidemics • Influenza and other diseasescan spread quickly over time or space • Use modeling to aid decision making • Policies (e.g., school closure, quarantining) • Planning (e.g., vaccines, treatments) • Response (e.g., supply prepositioning, points of distribution, etc. • Simulation: SEIR-type models can represent each individual’s status (Susceptible to Recovered), and agent-based simulation allows interactions over network • Studied mutations, seasonality, traveling, and policies • Post-campaign analysis • State distribution systems and associated leadtimes affected vaccination rates at the state level (statistical analysis) • Access to vaccines in shortage period showed some inequities(optimization and statistics) • Future: Cholera and other studies Day 90, Forecast Estimated Scarcity
Healthcare Access 2. Infer disparities Main determinants of Access to Pediatricians are: Income, Education, Population density and Segregation • Measure access. • Infer disparities. • Design interventions. • Link to outcomes. • Develop approaches for projecting system changes with application to common conditions (e.g., asthma) and rare ones (e.g., Cystic Fibrosis) across different network types • Utilizes optimization to “match” supply and demand and statistics for analysis 1. Access to Pediatricians in GA 3. Design interventions Increasing participation of MD taking Medicaid would improve Access for Medicaid patients without compromising access for overall population 4. Link to outcomes Ex, Access affects outcomes. Use to design more effective interventions Approved IRBs for Medicaid claims data across 14 states and 5 years, CF registry data, and AHRQ hospital utilization data 1. Estimated distance to Cystic Fibrosis Centers and uncovered areas
Disease Prevalence • What is the expected level of disease in each area, so interventions may be targeted effectively? • Prevalence of pediatric obesity differs by population characteristics and/or geographically; widespread survey may be costly • Statistical modeling can be used to project prevalence in “small” geographical areas” • Build regression to predict probability child is overweight or obese • NHANES (with examinations) or NSCH (self-reported) • Combine with a simulation of virtual individuals from Census data • Validated with external data and compared to CDC approach Results used to target interventions by a large healthcare provider in GA Priority Areas: ~ 80% of the overweight children in GA Prevalence (zip codes) Number of Children (2-17)
Decision Support: Vaccination Tool • Many children have late, early or missed vaccinations • Aim: a freely available and easy to use automated tool for catch-up scheduling using vaccination history and feasibility rules • Approach: dynamic programming in Excel or other platforms • Online Childhood Scheduler (Keskinocak, Pickering, and collaborators)https://www.vacscheduler.org/http://www.cdc.gov/vaccines/schedules/easy-to-read/child.html400,000+ downloads or online visits across all scheduler tools (adult, adolescents, children)
Collaborations with the CDC IPA; ORISE Fellowship PERRC Seed Grant • Influenza and Emergency Response • On loan during H1N1 pandemic • Supply chain factors associated with variation in vaccination uptake by state • Access to vaccine during shortage period • Obesity and Nutrition • Prediction of pediatric obesity in geographical small-areas • Global Health • Tool to evaluate health kits pushed to points of distribution • Chronic or Infectious Diseases • Role of Bathhouses and Sex Clubs in HIV transmission • Screening policies for diseases • Immunization • Catch-up Vaccination Scheduler GT-CDC Seed Grant RFP for Small Business w/ subcontract to GT Blood, Sweat & Tears
How Projects Began • HIV policy analysis (2003) • CDC scientist approached GT faculty they knew socially for assistance with building a computational model • Immunization (2007): • GT faculty met with individual CDC scientists to solicit “challenging problems” that needed solving • H1N1 Pandemic Projects (2009+) • GT asked to participate in pandemic response based on relationships and two years of previous research in area • While there, GT researchers identified other questions of interest, not being asked by the CDC • Global Health (2012) • CDC scientists solicited ideas to spend year-end money • Obesity (2012) • GT faculty approached CDC groups with idea for seed grant until found right people
Conclusions • Appropriate public health problems • Almost any, and methods may need to be integrated • Much data exists already that can be utilized • How such research can be performed • Identification of existing or new problem • Availability of data • Sufficient resources • Results • Understanding of complex problems • Publications of research results and/or tool development • Efficient, Effective, Equitable outcomes
Analytics in Public Health for “Efficient, Effective, and Equitable” Outcomes • Other Collaborators • Jim Bost (CHOA) • Michael deGuzman (Children’s NY) • Ozlem Ergun (GT) • Paul Griffin (Penn State) • Anne Fitzpatrick (Emory) • Bruce Lee (Johns Hopkins) • Stephen Onufrak (CDC) • Michael Schechter (VCU) • Michael Washington (CDC) • Pascale Wortley (CDC) • Xingyou Zhang (CDC) • (+ advisees and others) • Julie Swann, PhDjswann@isye.gatech.eduhttp://humanitarian.gatech.edu • GT faculty or scientists in area • Turgay Ayer • Rahul Basole • Dave Goldsman • Pinar Keskinocak • Eva Lee • NicoletaSerban • (+ students and others)