Download
1 / 30
300 likes | 554 Views
The Phillips Curve. The Relationship Between Inflation and Unemployment An inverse relationship between inflation and unemployment until the 1970s 1970s high inflation and unemployment Is there still a relationship between inflation and unemployment?. The 1960s: A Policy Menu?.

E N D
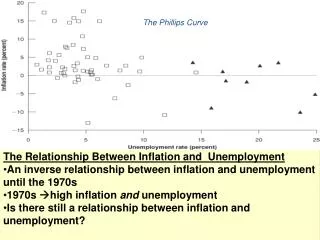
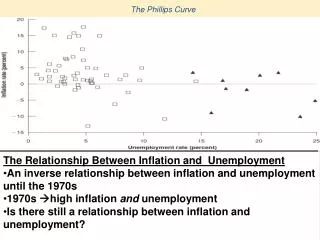
The Phillips Curve • The Relationship Between Inflation and Unemployment • An inverse relationship between inflation and unemployment until the 1970s • 1970s high inflation and unemployment • Is there still a relationship between inflation and unemployment?
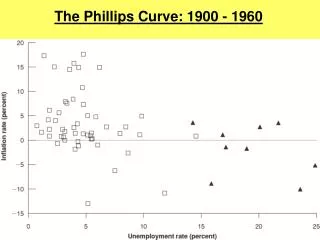
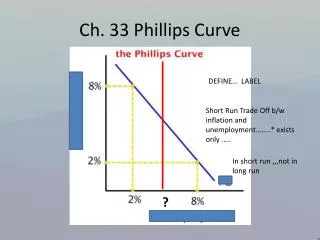
The Discovery of the Short-Run Trade-offbetween Unemployment and Inflation Phillips curve A curve showing the short-run relationship between the unemployment rate and the inflation rate. The Phillips Curve
What is meant by the Phillips Curve “tradeoff”? • A) High inflation results in high unemployment • B) High unemployment results in low inflation • C) High inflation eventually slows down • D) High unemployment eventually returns to normal
The Discovery of the Short-Run Trade-offbetween Unemployment and Inflation Explaining the Phillips Curve with Aggregate Demand and Aggregate Supply Curves Using Aggregate Demand and Aggregate Supply to Explain the Phillips Curve
Why might the Phillips Curve shift? • A) Inflation is expected to increase • B) Inflation slows so unemployment rises • C) Unemployment is expected to increase • D) The Phillips Curve is stable. It doesn’t shift.
1970s: Why did the Phillips curve vanish?higher oil prices inflation became persistent and positive
Is the Phillips Curve a Policy Menu? Is the Short-Run Phillips Curve Stable? • 1960s: the basic Phillips curve relationship seemed to hold • 1968: Milton Friedman of the University of Chicago argued that the Phillips curve did not represent a permanent trade-off between unemployment and inflation. • Unexpected inflation reduces real wages more hiring The Long-Run Phillips Curve Natural rate of unemployment The unemployment rate that exists when the economy is at potential GDP.
The Long-Run Phillips Curve Natural rate of unemployment The unemployment rate that exists when the economy is at potential GDP. A Vertical Long-Run Aggregate Supply Curve Means a Vertical Long-Run Phillips Curve
The natural rate of unemployment can never change. • A) True • B) False
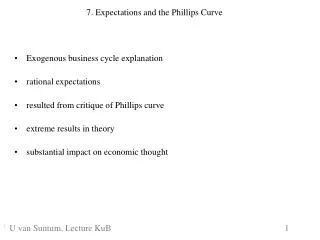
The Role of Expectations of Future Inflation The Basis for the Short-Run Phillips Curve
The Short-Run and Long-Run Phillips Curves The Short-Run Phillips Curve of the 1960s and the Long-Run Phillips Curve
The Short-Run and Long-Run Phillips Curves The Inflation Rate and the Natural Rate of Unemployment in the Long Run Nonaccelerating inflation rate of unemployment (NAIRU) The unemployment rate at which the inflation rate has no tendency to increase or decrease.
The natural rate of unemployment is also referred to as • A) The non-accelerating inflation rate of unemployment • B) The full employment rate of unemployment • C) The equilibrium rate of unemployment • D) All of the above • E) None of the above. The “natural rate” is natural and nothing else.
Frictional or structural unemployment can change—thereby changing the natural rate—for several reasons: • Does the Natural Rate of Unemployment Ever Change? • • Demographic changes. • • Labor market institutions. • Strength of unions • Generous unemployment benefits • Labor mobility • Labor market flexibility • • Past high rates of unemployment. • Other costs of production and the real wage • Oil price and the “natural rate”
Expectations of the Inflation Rate and Monetary Policy The experience in the United States over the past 50 years indicates that how workers and firms adjust their expectations of inflation depends on how high the inflation rate is. There are three possibilities: • Low inflation. • Moderate but stable inflation. • High and unstable inflation. Rational expectations Expectations formed by using all available information about an economic variable.
Expectations of the Inflation Rate and Monetary Policy The Effect of Rational Expectations on Monetary Policy Real business cycle models Models that focus on real rather than monetary explanations of fluctuations in real GDP. Rational Expectations and the Phillips Curve Rational expectations Expectations formed by using all available information about an economic variable, including what you’ve learned in college. • Rational expectations • Policy ineffectiveness • Don’t bother with expansionary policy Laissez - faire
According to the rational expectations hypothesis, if people expect the Fed to increase the growth rate of the money supply • They will demand and get higher wages • Price will rise and the real wage won’t change • Employment and output will not change • All of the above • None of the above,
Is the Short-Run Phillips Curve Really Vertical? • Many economists remain skeptical that the short-run Phillips curve is vertical. • workers and firms actually may not have rational expectations, and • the rapid adjustment of wages and prices needed for the short-run Phillips curve to be vertical will not actually take place. • Wage and price “stickiness” • Staggered contracts
Fed Policy from the 1970s to the Present The Effect of a Supply Shock on the Phillips Curve A Supply Shock Shifts the SRAS and the Short-Run Phillips Curve When OPEC increased the price of a barrel of oil from less than $3 to more than $10, in panel (a), the SRAS curve shifted to the left. Between 1973 and 1975, real GDP declined from $4,917 billion to $4,880 billion, and the price level rose from 28.1 to 33.6. Panel (b) shows that the supply shock shifted up the Phillips curve. In 1973, the U.S. economy had an inflation rate of about 5.5 percent and an unemployment rate of about 5 percent. By 1975, the inflation rate had risen to about 9.5 percent and the unemployment rate to about 8.5 percent.
How the Fed Fights Inflation Paul Volcker and Disinflation The Fed Tames Inflation, 1979–1989
The Volcker Disinflation demonstrates that people have and act on rational expectations • A) True • B) False
Using Monetary Policy to Lower the Inflation Rate Once the short-run Phillips curve has shifted down, the Fed can use an expansionary monetary policy to push the economy back to the natural rate of unemployment.
Fed Policy from the 1970s to the Present Paul Volcker and Disinflation Don’t Let This Happen to YOU! Don’t Confuse Disinflation with Deflation Disinflation refers to a decline in the inflation rate. Deflation refers to a decline in the price level.
The Great Depression demonstrates that deflation lowers unemployment. • A) True • B) False
How the Fed Fights Inflation De-emphasizing the Money Supply • The Fed learned an important lesson during the1970s: • Workers, firms, and investors in stock and bond markets have to view Fed announcements as credible if monetary policy is to be effective.
How the Fed Fights Inflation Monetary Policy Credibility after Greenspan • Central banks are more credible if they adopt and follow rules. • Rules (e.g., Taylor Rule) vs. discretion • A middle course between rules and discretion: • Inflation targeting. • The best way to achieve commitment to rules • remove political pressures on the central bank.
The Great Moderation!?! Alan Greenspan, Ben Bernanke, and the Crisis in Monetary Policy Greenspan’s ability to help guide the economy through a long period of economic stability and his moves to enhance Fed credibility were widely applauded. However, two actions by the Fed during Greenspan’s term have been identified as possibly contributing to the financial crisis that increased the length and severity of the 2007–2009 recession. The Decision to Intervene when Long –Term Capital Management failed The Decision to Keep the Target for the Federal Funds Rate at 1 percent from June 2003 and June 2004
AN INSIDE LOOK >> The Fed Faces the Phillips Curve Once Again Phillips Curve Makes Ugly Comeback The short-run Phillips curve can be seen in the data for the period from mid-2008 to early 2009.
K e y T e r m s Disinflation Natural rate of unemployment Nonaccelerating inflation rate of unemployment (NAIRU) Phillips curve Rational expectations Real business cycle models Structural relationship