Download
1 / 74
740 likes | 830 Views
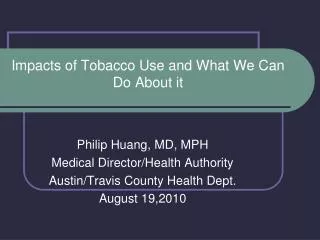
Impacts of Tobacco Use and What We Can Do About it. Philip Huang, MD, MPH Medical Director/Health Authority Austin/Travis County Health Dept. August 19,2010. Summary:. Burden and Impacts of Tobacco Use What we are doing about it - ARRA Communities Putting Prevention to Work (CPPW)

E N D
Impacts of Tobacco Use and What We Can Do About it Philip Huang, MD, MPH Medical Director/Health Authority Austin/Travis County Health Dept. August 19,2010
Summary: • Burden and Impacts of Tobacco Use • What we are doing about it - ARRA Communities Putting Prevention to Work (CPPW) • Policy Change • Cessation resources • How can we work together?
Leading Causes of Death, Travis County, 2007 Data Source: Texas Department of State Health Services, Center for Health Statistics http://soupfin.tdh.state.tx.us/death10.htm
Diseases of the Heart1 Age Adjusted Mortality Rate Travis County 1999-2006 1 ICD 9 Codes: I00-I09, I11, I13, I20-I51 Data Source: Texas Department of State Health Services, Center for Health Statistics http://soupfin.tdh.state.tx.us/death10.htm
Cancer Death Rates*, for Men, US, 1930-1999 Rate Per 100,000 Lung Prostate Stomach Colon and rectum Pancreas Leukemia Liver *Age-adjusted to the 2000 US standard population. Source: US Mortality Public Use Data Tapes 1960-1999, US Mortality Volumes 1930-1959, National Center for Health Statistics, Centers for Disease Control and Prevention, 2002.
Cancer Death Rates*, for Women, US, 1930-1999 Rate Per 100,000 Lung Uterus Breast Colon and rectum Stomach Ovary Pancreas *Age-adjusted to the 2000 US standard population. Source: US Mortality Public Use Data Tapes 1960-1999, US Mortality Volumes 1930-1959, National Center for Health Statistics, Centers for Disease Control and Prevention, 2002.
Lung and Bronchus Cancer1 Age Adjusted Mortality Rate Travis County 1999-2006 1 ICD 9 Codes: C34 * The number of deaths due to Lung and Bronchus Cancer for Hispanics is too small for rate calculation in 2001 and 2003. Data Source: Texas Department of State Health Services, Texas Cancer Registry, http://www.cancer-rates.info/tx/
Leading Causes of Death, Travis County, 2007 Data Source: Texas Department of State Health Services, Center for Health Statistics http://soupfin.tdh.state.tx.us/death10.htm
Smoking-Attributable DeathsTravis County, 2007 Approximately 584 deaths caused by smoking among adults 35+ years in Travis County (over 11 each week)
Health Effects of Tobacco Use • Cigarette smoking remains the leading preventable cause of death in the United States, causing an estimated 438,000 deaths - or about 1 out of every 5 - each year. (In 2007 in Travis County approximately 584 smoking-related deaths-over 11 per week) • Tobacco kills more than AIDS, heroin, cocaine, alcohol, car accidents, fire and murder – combined. • Lung cancer is the leading cause of cancer death among both men and women in the United States, with 85- 90 percent of lung cancer deaths attributed to smoking. • Smoking also increases the risk of many other types of cancer, including cancers of the throat, mouth, pancreas, kidney, bladder, and cervix. • People who smoke are up to six times more likely to suffer a heart attack than nonsmokers, and the risk increases with the number of cigarettes smoked. Smoking also causes most cases of chronic obstructive lung disease, which includes bronchitis and emphysema. • In the United States, approximately 38,000 deaths each year are caused by exposure to secondhand smoke.
Tobacco Use in the US, 1900-2000 Per capita cigarette consumption Male lung cancer death rate Female lung cancer death rate *Age-adjusted to 2000 US standard population. Source: Death rates: US Mortality Public Use Tapes, 1960-2000, US Mortality Volumes, 1930-1959, National Center for Health Statistics, Centers for Disease Control and Prevention, 2002. Cigarette consumption: US Department of Agriculture, 1900-2000.
Second-Hand Smoke (SHS) • Public Health Issue • Contains over 4,000 chemicals including 69 known carcinogens • Group A Carcinogen (like asbestos and benzene) • Health Effects: Adults • Lung cancer • Coronary heart disease • Health Effects: Children • Lower respiratory tract infections in children < 18 months old each year • Middle ear infections • Asthma • SIDS
Even Brief Exposure to SHS Poses Serious Health Risks • Even brief exposure to SHS can: • result in upper airway changes in healthy persons • lead to more frequent asthma attacks in asthmatic children • Just 30 minutes of exposure to SHS can: • increase risk of blot clots • slow the rate of blood flow through the coronary arteries • injure blood vessels and interfere with their repair
Who Smokes – By Education and IncomeCurrent Population Survey - Tobacco Use Supplement
Homeless • About one-third to one-half of the 750,000 homeless individuals in the U.S. have chronic diseases, and more than half lack health insurance. Homeless individuals have a life expectancy of between ages 42 and 52, according to National Health Care for the Homeless Council. • Among the homeless, the cigarette smoking rate is an alarming 70% or more; these rates are 3 times higher than national average. Two of the three leading causes of death among homeless persons, heart disease and cancer are tobacco related
Homeless (Cont.) • Many of those working with homeless people do not regard smoking as a priority. • As a result of their low income, they use tobacco in an even more hazardous way: hand-rolled cigarettes without filters; recycled tobacco from butts; group smoking, a cigarette passing from mouth to mouth. They also leave shorter butts by smoking the cigarette down as close to the filter or to the end as possible. • Many homeless people who smoke want to quit. • There is real opportunity for helping this population. • Actions include: recognizing that smoking is a major cause of ill health among homeless people; offering a tobacco-free environment; making smoking cessation services more accessible to homeless smokers; and providing resources to those who want to quit.
Prevalence of Cigarette Smoking Among Youth1, Texas’ Public Schools 2001, 2005, 2007, 2009 1Youth is defined as a student in public schools ranging in age from 15-18 years old. Data Source: Texas Department of State Health Services, Center for Health Statistics http://www.dshs.state.tx.us/chs/yrbs/query/yrbss_form.shtm
Economic Cost • In 1998/1999, Texas Smoking-Attributable Costs = $10.09 billion • Direct Medical expenditures - $4.55 billion • Lost Productivity costs - $5.54 billion • In 1998, about 15% ($1,265,000,000 or $543.87 per recipient) of all Texas Medicaid expenditures were spent on smoking-related illnesses and diseases. (includes state and federal contributions to Medicaid)
Potentially Preventable Hospitalizations Tobacco-Related Diseases Travis County, 2005-2008
Economic Costs Due To SmokingTravis County, 2007 584 deaths caused by smoking among adults 35+ years • Loss of future earnings and productivity of $165.4 million • 2004 Direct Health Care Costs for Travis County- $243 million
Smokefree Laws:Employer Economic Issues • Absenteeism • Illness and discomfort among non-smokers to SHS • Health insurance and life insurance costs and claims • Smoke pollution (increased cleaning and maintenance costs) • The US EPA estimates that smokefree restaurants can expect to save about $190 per 1,000 square feet each year in lower cleaning and maintenance costs.
Smokefree Laws:Employer Economic Issues • Liability • Workers Compensation • Employee filed claims • Increased employer premiums • Disability Discrimination • Failing to provide a “reasonable accommodation” (e.g worker with asthma) • Failure to Provide a Safe Workplace • Secondhand smoke cases have been filed against the hospitality industry, and won or settled favorably
Smokefree Laws:Employer Economic Issues • Accidents, property damage and fires (plus related insurance costs) • Matches and cigarettes account for 12% and 9% of outdoor fires (According to CleanUp.org.au, "a cigarette butt can smolder for up to three hours causing a grass fire or even a bushfire“) • The National Fire Protection Association found that in 1998 smoking materials caused 8,700 fires in non-residential structures resulting in direct property damage of $60.5 million. • According to a study by the Department of Epidemiology and Preventive Medicine at the University of California, "Smoking causes an estimated 30% of U.S. and 10% of global fire death burdens." • Landlords and restaurants with smokefree premises have negotiated lower fire and property insurance premiums.
Green and Tobacco-Free • According to the Smithsonian Institute, "it takes ten years for one cigarette butt to degrade." • According to Eco Recycle, "50% of all litter in urban areas is tobacco-related products including butts, cellophane wrapping, foil inserts and packaging." • According to Cigarette Litter Org, "4.5 trillion cigarette butts are littered worldwide every year." • According to the Texas Department of Transportation: "130 million butts will be tossed out in Texas alone this year.“ • San Francisco - spends over $6 million annually to clean cigarette litter
Texas Employer Costs of Smoking Estimated annual EXCESS absence and productivity cost per smoker $2,625 (not including health costs) • Smoke breaks $2,261 • 26 minutes per day more than non-smokers (Source: Study by Halpern and Rentz) multiplied by the Texas average hourly wage $19.76 (Source: Bureau of Labor Statistics, May 2009) • Absences $364 • 2.3 days of additional absences (Source: Study by Halpern and Rentz) multiplied by Texas average hourly wage of $19.76. (Source: Bureau of Labor Statistics, May 2009)
Comprehensive smoke-free workplacelaws reduce cigarette consumption • Tobacco-free environments reduces smoking prevalence by 3.8% and helps ex-smokers by eliminating cues to smoke and (Study by Fichtenberg and Glantz). Excerpts from Philip Morris internal documents • “…total prohibition of smoking in the workplace strongly affects industry volume. Smokers facing these restrictions consume 11%-15% less than average and quit at a rate that is 85% higher than average...Milder workplace restrictions, such as smoking only in designated areas, have much less impact on quitting rates and very little effect on consumption.” • “…financial impact of smoking bans will be tremendous –three to five fewer cigarettes per day per smoker will reduce annual manufacturer profits a billion dollars plus per year.”
Tobacco Industry Expenditures • In 2006 the Tobacco Industry spent $12.49 billion on advertising and promotion in the U.S. • Approximately $1.01 billion was spent in Texas in 2006 (over $2.76 million every single day) • Approximately $41.75 million was spent in Travis County in 2006 ($114,400 every single day)
Criteria for Evaluating Economic Studies • Based on objective data (i.e. sales tax) • Includes data for a sufficient time period before and after the ordinance • Accounts for underlying economic trends • Uses appropriate statistical methods • In peer-reviewed literature • Source of funding
Texas Economic StudiesMethods • Quarterly data obtained from the Texas Comptroller’s Office • Taxable restaurant, bar and mixed beverage sales • Total retail sales • Linear regression model to assess the economic impact of clean indoor air ordinances
Figure 1. Gross Restaurant, Bar and Mixed Beverage Revenues By Fiscal Quarter*—El Paso, Texas, 1990-2002 Smoking Ban in effect January 2, 2002 * First fiscal quarter of each year is January 1 –March 31
Figure 2. Restaurant, Bar and Mixed Beverage Revenues, Percent of Total Retail Revenues by Fiscal Quarter*—El Paso, Texas, 1990-2002 Smoking Ban in effect January 2, 2002 * First fiscal quarter of each year is January 1 –March 31
Summary • 2003 study offered a comprehensive view of all available studies on the economic impact of smoke-free workplace laws (Over 97 studies, including 34 with smoke-free bars) • The study concluded that: “All of the best designed studies report no impact or a positive impact of smoke-free restaurant and bar laws on sales or employment. Policymakers can act to protect workers and patrons from the toxins in secondhand smoke confident in rejecting industry claims that there will be an adverse economic impact.” Scollo M, et al, Review of the quality of studies on the economic effects of smoke-free policies on the hospitality industry, Tobacco Control (2003); 12:13-20.
Poor Quality Literature on Smoke-Free Bars and Restaurants • Supported by Tobacco Industry • Survey of bar owners on predicted impacts or anecdotal information • Bizarre time periods or inappropriate control groups for comparison • Non-peer reviewed
Plausibility • In Texas there are over 4 times as many adult non-smokers as smokers • Prior experiences • Airline bans • Movie theatres • Texas Adult Survey
Texas Adult Survey (BRFSS)2009 • If there were a total ban on smoking in restaurants, would you eat out: • More often 27% • Less often 6% • No difference 67%
Texas Adult Survey (BRFSS)2009 • If there were a total ban on smoking in bars and music clubs, would you go to bars and music clubs: • More often 19% • Less often 8% • No difference 73%
“Back in 2002, when the City Council was weighing Mayor Michael R. Bloomberg’s proposal to eliminate smoking from all indoor public places, few opponents were more fiercely outspoken than James McBratney, president of the Staten Island Restaurant and Tavern Association. He frequently ripped Mr. Bloomberg as a billionaire dictator with a prohibitionist streak that would undo small businesses like his bar and his restaurant. Visions of customers streaming to the legally smoke-filled pubs of New Jersey kept him awake at night. Asked last week what he though of the now two-year-old ban, Mr. McBratney sounded changed. “I have to admit,” he said sheepishly, “I”ve seen no falloff in business in either establishment.” He went on to describe what he once considered unimaginable: Customers actually seem to like it and so does he. New York Times Feb 6, 2005
Austin/Travis County CPPW Award • Awarded $7.47 Million over 2 years to address tobacco • One of 44 communities selected (out of 263 applicants) • Extremely tight timelines • Expectation to perform • “The world is watching” • Implications for future funding
Health Care Reform Legislation SEC. 4002 PREVENTION AND PUBLIC HEALTH FUND (a) PURPOSE.—It is the purpose of this section to establish a Prevention and Public Health Fund (referred to in this section as the ‘‘Fund’’), to be administered through the Department of Health and Human Services, Office of the Secretary, to provide for expanded and sustained national investment in prevention and public health programs to improve health and help restrain the rate of growth in private and public sector health care costs. (b) FUNDING.—There are hereby authorized to be appropriated to the Fund, out of any monies in the Treasury not otherwise appropriated— (1) for fiscal year 2010, $500,000,000; (2) for fiscal year 2011, $750,000,000; (3) for fiscal year 2012, $1,000,000,000; (4) for fiscal year 2013, $1,250,000,000; (5) for fiscal year 2014, $1,500,000,000; and (6) for fiscal year 2015, and each fiscal year thereafter, $2,000,000,000.
CPPW Strategies Emphasize high-impact, broad-reaching • Policy, • Environmental • Systems changes
Policy, Systems & Environmental Change What they mean is, overcome the Stickiness Problem.
Exercise ParticipationEffect of Short Bouts, Home Treadmills(Jakicic et.al., JAMA 282, 16) ? mark.fenton@verizon.net