Download

1 / 1
10 likes | 131 Views
Rosat (added to constrain the model). North Polar Spur Fields. PN. Northern Fields. MOS. NeIX. NeX. OVII. OVIII. FeXII. Galactic Halo. Loop 1. Residuals. Southern Fields. Loop 1 model boundary. Galactic Halo. Cosmic Sources. Local Hot Bubble (LHB). Loop1 Superbubble.

E N D
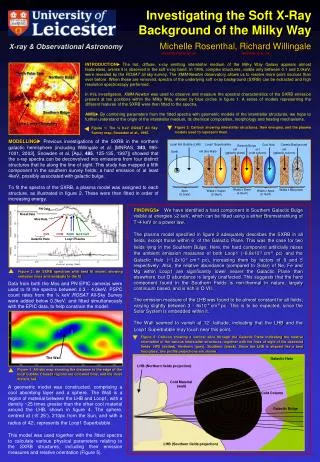
Rosat (added to constrain the model) North Polar Spur Fields PN Northern Fields MOS NeIX NeX OVII OVIII FeXII Galactic Halo Loop 1 Residuals Southern Fields Loop 1 model boundary Galactic Halo Cosmic Sources Local Hot Bubble (LHB) Loop1 Superbubble Galactic Bulge nH (the Wall) nH (galactic plane) nH (cold column) nH (galactic column) Earth Wabs x Mekal (4.0keV) Wabs x Apec (0.1keV) Wabs x Bknpower Wabs x Vapec (0.3keV) Apec (0.1keV) Loop 1 boundary LHB The Wall Loop1 N5 N4 LHB (Northern fields projection) NPS fields Increasing pressure Increasing density Northern Bulge Fields X3 X2 Cold Column Latitude = 25° Loop1 Superbubble Galactic Bulge X1 The Wall Southern Bulge Fields LHB (Southern fields projection) Circled points are from the centre of Loop 1 The Soft X-Ray Background in the Loop 1 Region Michelle Supper, Richard Willingale X-ray & Observational Astronomy rw@star.le.ac.uk mar23@star.le.ac.uk 1: INTRODUCTION The soft (0.1–4.0keV) X-ray photons emitted by supernova remnants, such as the Local Hot Bubble, Loop 1, hot phases of the Interstellar Medium such as the Galactic Halo, and also distant quasars make up the Soft X-ray Background (SXRB) of the Milky Way. XMM-Newton EPIC was used to observe ten positions within the boundary of the Loop 1 Superbubble (figure 1). 2: FITTING SPECTRA Xspec models were assigned to the absorbing hydrogen column and to each emissive structure along the line of sight through Loop 1. The complete model was then fitted to the spectra (figures 2and 3). Figure 2: A fitted spectrum, showing emission lines and residuals to the fit. Figure 1: The ¾ keV Rosat All Sky Survey map, Snowden et al., 1995. Observed positions are indicated by blue circles. Spectra of the SXRB were extracted from each field. These were then fitted with a series of plasma models, revealing previously unseen interactions and components within the SXRB. Figure 3: Cartoon showing emissive interstellar structures, their energies, the absorptive regions, and the plasma models used to represent them. 4: LHB/LOOP1 INTERACTION Absorption studies have shown the LHB to be shaped like a bent hourglass (figures 4 and 5). The Wall is located between the indented edge of the LHB and Loop 1. The density of the Wall increases by a factor of 4 (from 8 to 35cm-3) and peaks near 25°latitude, the most indented region of the LHB. The electron pressure of the LHB also increases towards this point, indicating that the Wall is pushing into the LHB at in this region. • 3: GEOMETRIC MODELLING • The fitted parameters were combined with a geometric model in order to determine the physical properties of the interstellar structures (figure 4). The model includes: • The absorption boundary of the Local Hot Bubble (figure 5). • ‘The Wall’ – a dense region of cool, absorbing material lying between the LHB and the expanding shell of Loop 1. • The Loop 1 Superbubble – represented by a sphere, centred at (-8˚,25˚), 210pc from the Sun, and with an angular radius of 42˚. Blue=close, Red=distant Galactic Plane The Wall LHB indented, location of the Wall Figure 5: All-sky absorption map showing distance to the LHB boundary. Figure 6: Cartoon showing the possible interaction between Loop1, the Wall and the LHB. Figure 4: Cartoon showing a vertical slice through the Galactic Plane, showing the various interstellar structures and the lines of sight of the observed fields. 6: CHEMICAL ABUNDANCES 7: NEXT STEP: THE GALACTIC HALO 5: EXTRA HARD COMPONENT An additional hard X-ray component was required to fit the Southern fields lying within 6° of the Galactic Plane: modelled by a MEKAL of 2keV. The emission measure of the MEKAL increases exponentially towards the Galactic Plane, and is possibly associated with the galactic bulge. Unfortunately, we have no fields in the North close enough to the plane to confirm its presence there. The chemical abundances are high in the centre of Loop 1, while the outer shell is relatively depleted: typically 0.3 times Solar values. O and Fe are consistently lower than Solar values, while the Mg signal is reaches Solar values in the Loop 1 centre. Most of the OVIII appears to come from Loop 1, but most of the OVII appears to originate within the Galactic Halo. No-one is quite sure what the soft Galactic Halo is, but all SXRB spectra require it as a low surface brightness, soft X-ray component that extends beyond the Galactic Disc. It has an emission measure of ~6x10⁻³cm-6pc in the Northern fields, but is significantly higher in the South: possibly a result of enhancement by Galactic Plane radiation. It has a strong O VII signal. We are currently counting the photons of O VII and O VII within the fields shown in figure1, and 10 new fields beyond the boundary of Loop1. We hope to trace their distribution across the sky, and so gain insight into the nature of the Galactic Halo. Figure 8: Chemical Abundances vs. Latitude. Figure 7: MEKAL Emission Measure vs. Latitude. (Mekal KT frozen to 2keV)