
Soil Carbon Changes in Mexican Forestry: A 1993-2002 Analysis
Explore the quantification of carbon content changes in Mexico's forestry sector soils from 1993 to 2002 due to land use change (LULUCF). This study analyzes soil organic carbon data using a standardized database and spatial mapping techniques, revealing differences in carbon storage across soil types and vegetation units. The results indicate net CO2 emissions from Mexican forest soils during the studied period. This research provides insights into soil carbon dynamics and emissions in the forestry sector of Mexico.

Soil Carbon Changes in Mexican Forestry: A 1993-2002 Analysis
E N D
Presentation Transcript
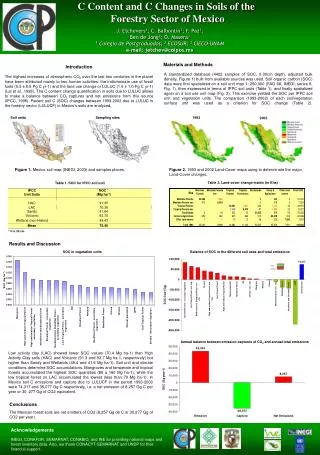
C Content and C Changes in Soils of the Forestry Sector of Mexico J. Etchevers1; C. Balbontín1; F. Paz1; Ben de Jong2; O. Masera3 1 Colegio de Postgraduados; 2 ECOSUR; 3CIECO-UNAM e-mail: jetchev@colpos.mx Materials and Methods IntroductionThe highest increases of atmospheric CO2 over the last two centuries in the planet have been attributed mainly to two human activities: the indicriminate use of fossil fuels (5.5 ± 0.5 Pg C yr-1) and the land use change or LULUC (1.6 ± 1.0 Pg C yr-1) (Lal et al., 1998). The C content change quantification in soils due to LULUC allows to make a balance between CO2 captures and net emissions from this source (IPCC, 1996). Recent soil C (SOC) changes between 1993-2002 due to LULUC in the forestry sector (LULUCF) in Mexico's soils are analyzed. A standardized database (4422 samples of SOC, 0-30cm depth, adjusted bulk density, Figure 1) built from available sources was used. Soil organic carbon (SOC) data were first spatialized on a soil unit map 1: 250,000 (FAO 68, INEGI, series II, Fig. 1), then expressed in terms of IPPC soil units (Table 1), and finally spatialized again on a soil use unit map (Fig. 2). This exercise yielded the SOC per IPPC soil unit and vegetation units. The comparison (1993-2002) of each soil/vegetation surface unit was used as a criterion for SOC change (Table 2). 1993 Soil units Sampling sites 2002 Figure 1. Mexico soil map (INEGI, 2003) and samples places. Figure 2. 1993 and 2002 Land-Cover maps using to determinate the major Land-Cover changes. Table 2. Land-cover change matrix (in Kha) Table 1. SOC for IPCC soil unit * 0 to 30 cm Results and Discussion SOC in vegetation units Balance of SOC in the different soil uses and total emissions Annual balance between emission-captures of CO2 and annual total emissions Low activity clay (LAC) showed lower SOC values (70.4 Mg ha-1) than High Activity Clay soils (HAC) and Volcanic (91.3 and 93.7 Mg ha-1, respectively) but higher than Sandy and Wetlands (49.4 and 41.6 Mg ha-1). Soil unit and climate conditions determine SOC accumulations. Mangroves and temperate and tropical forests accumulated the highest SOC quantities (80 a 160 Mg ha-1), while the low tropical forest on LAC accumulated the lowest (less than 70 Mg ha-1). In Mexico soil C emissions and capture due to LULUCF in the period 1993-2000 were 74,317 and 35,077 Gg C respectively, i.e. a net emission of 8,257 Gg C per year or 30, 277 Gg of CO2 equivalent. Conclusions The Mexican forest soils are net emitters of CO2 (8,257 Gg de C or 30,277 Gg of CO2 per year). • Acknowledgements • INEGI, CONAFOR, SEMARNAT, CONABIO, and INE for providing national maps and forest inventory data. Also, we thank CONACYT-SEMARNAT andUNDPfor their financial support.


