
Understanding Log Odds Ratios in Sequence Alignment and Evolutionary Modeling
E N D
Presentation Transcript
Sequence Alignment IIILecture #4 Background Readings: The second chapter (pages 12-45) in the text book, Biological Sequence Analysis, Durbin et al., 2001. Chapter 3 in Introduction to Computational Molecular Biology, Setubal and Meidanis, 1997. This class has been edited from Nir Friedman’s lecture which is available at www.cs.huji.ac.il/~nir. Changes made by Dan Geiger and Shlomo Moran. .
Log Odd-Ratio Test for Alignment Score(s[i],t[i]) Taking logarithm of Q yields If log Q > 0, then s and t are more likely to be related. If log Q < 0, then they are more likely to be unrelated. How can we relate this quantity to a score function ?
Mutation counts be the number of mutations ab, be the total number of mutations that involve a, be the total number of amino acids involved in a mutation. Note that f is twice the number of mutations. Estimating p(·,·) for proteins Generate a large diverse collection of accepted mutations. An accepted mutationis a mutation due to an alignment of closely related protein sequences. For example, Hemoglobin alpha chain in humans and other organisms (homologous proteins). Let pa = na/n where na is the number of occurrences of letter a and n is the total number of letters in the collection, so n = ana.
We define Mab, such that only 1% of amino acids change according to this matrix or 99% don’t. Hence the name, 1-Percent Accepted Mutation (PAM). In other words, PAM-1 matrices Define Mab to be the symmetric probability matrix for switching between a and b. We set, Maa = 1 – ma, so that ma is the probability that a is involved in a change.
We select K to satisfy the PAM-1 definition: PAM-1 matrices We wish that ma will be proportional to the relative mutability of letter a compared to other letters. where K is a proportional constant. So K=100 for PAM-1 matrices. Note that K=50 yields 2% change, etc.
Evolutionary distance The choice that 1% of amino acids change (and that K =100) is quite arbitrary. It could fit specific set of proteins whose evolutionary distance is such that indeed 1% of the letters have mutated. This is a unit of evolutionary change, not time because evolution acts differently on distinct sequence types. What is the substitution matrix for k units of evolutionary time ?
A T T C T A C C G G Model of Evolution We make some assumptions: • Each position changes independently of the rest • The probability of mutations is the same in each position • Evolution does not “remember” Time t+ t+2 t+3 t+4 t
Model of Evolution • How do we model such a process? • This process is called a Markov Chain A chain is defined by the transition probability • P(Xt+=b|Xt=a) - the probability that the next state is b given that the current state is a • We often describe these probabilities by a matrix:M[]ab =P(Xt+=b|Xt=a)
Using Conditional independence (No memory) Multi-Step Changes • Based on Mab, we can compute the probabilities of changes over two time periods • Thus M[2] = M[]M[] • By induction (HMW exercise): M[n] = M[] n
X1 X2 Xn-1 Xn where Pai are the parents of variable/node Xi ,namely, none or Xi-1. In short, we write: A Markov Model (chain) • Every variable xi has a domain. For example, suppose the domain are the letters {a, c, t, g}. • Every variable is associated with a local probability table • P(Xi = xi | Xi-1= xi-1 ) and P(X1 = x1 ). • The joint distribution is given by
M M X1 X2 Xn-1 Xn The quantity we computed earlier from this model was the joint probability table Markov Model of Evolution Revisited In the evolution model we studied earlier we had P(x1) = (pa, pc, pg, pt) which sum to 1 and called the prior probabilities, and P(xi|xi-1) = M[] which is a stationary transition probability table, not depending on the index i.
Longer Term Changes • Estimate M[]= M (PAM-1 matrices) • Use M[n] = Mn (PAM-n matrices) • Define • Use this quantity to define the score for your application of interest.
Comments regarding PAM • Historically researchers use PAM-250. (The only one published in the original paper.) • Original PAM matrices were based on small number of proteins (circa 1978). Later versions use many more examples. • Used to be the most popular scoring rule, but there are some problems with PAM matrices.
Degrees of freedom in PAM definition With K=100 the 1-PAM matrix is given by With K=50 the basic matrix is different, namely: Thus we have two different ways to estimate the matrix M[4] : Use the 1-PAM matrix to the fourth power: M[4] = M[] 4 Or Use the K=50 matrix to the second power: M[4] = M[2] 2
Problems in building distance matrices • How do we find pairs of aligned sequences? • How far is the ancestor ? • earlier divergence low sequence similarity • later divergence high sequence similarity E.g., M[250] is known not reflect well long period changes. • Does one letter mutate to the other or are they both mutations of a third letter ?
BLOSUM Outline • Idea: use aligned ungapped regions of protein families.These are assumed to have a common ancestor. Similar ideas but better statistics and modeling. • Procedure: • Cluster together sequences in a family whenever more than L% identical residues are shared. • Count number of substitutions across different clusters (in the same family). • Estimate frequencies using the counts. • Practice: Blosum50 and Blosum62 are wildly used. (See page 43-44 in the text book). Considered state of the art nowadays.
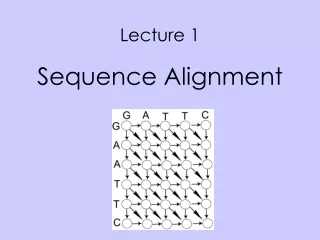
A - T A G - G T T G G G G T G G - - T - A T T A - - A - T A C C A C C C - G C - G - Possible alignment Possible alignment Multiple Sequence Alignment S1=AGGTC S2=GTTCG S3=TGAAC
Multiple Sequence Alignment Aligning more than two sequences. • Definition: Given strings S1,S2,…,Ska multiple (global) alignment map them to strings S’1,S’2,…,S’k that may contain blanks, where: • |S’1|= |S’2|=…= |S’k| • The removal of spaces from S’ileaves Si
x1 x2 x3 x4 Multiple alignments We use a matrix to represent the alignment of k sequences, K=(x1,...,xk). We assume no columns consists solely of blanks. The common scoring functions give a score to each column, and set: score(K)=∑i score(column(i)) For k=10, a scoring function has 2k -1 > 1000 entries to specify. One need not have a general function. For example, the order of arguments need not matter: score(I,_,I,V) = score(_,I,I,V).
SUM OF PAIRS A common scoring function is SP – sum of scores of the projected pairwise alignments: SPscore(K)=∑i<j score(xi,xj). Note that we need to specify the score(-,-) because a column may have several blanks (as long as not all entries are blanks). In order for this score to be written as∑i score(column(i)), we must specify score(-,-)=0. Why ? Because these entries appear in the sum of columns but not in the sum of projected pairwise alignments (lines).
Definition: The sum-of-pairs (SP) value for a multiple global alignment A of k strings is the sum of the values of all projected pairwise alignments induced by A where the pairwise alignment function score(xi,xj) is additive. SUM OF PAIRS
3 +4 3 + 4 + 5 = 12 3 Example Consider the following alignment: a c - c d b - - c - a d b d a - b c d a d Using the edit distance and for , this alignment has a SP value of
For each vector i =(i1,..,ik), compute an optimal multiple alignment for the k prefix sequences x1(1,..,i1),...,xk(1,..,ik). The adjacent entries are those that differ in their index by one or zero. Each entry depends on 2k-1 adjacent entries. Multiple Sequence Alignment Given k strings of length n, there is a natural generalization of the dynamic programming algorithm that finds an alignment that maximizes SP-score(K) = ∑i<j score(xi,xj). Instead of a 2-dimensional table, we now have a k-dimensional table to fill.
The idea via K=2 Recall the notation: and the following recurrence for V: Note that the new cell index (i+1,j+1) differs from previous indices by one of 2k-1 non-zero binary vectors (1,1), (1,0), (0,1).
The idea for arbitrary k Order the vectors i=(i1,..,ik) by increasing order of the sum ∑ij. Set s(0,..,0)=0, and for i > (0,...,0): Where • The vector b ranges over all non-zero binary vectors. • The vector i-b is the non-negative difference of i and b. • The jth entry of column(i,b)equals cj=xj(ij) if bi=1, and cj= ‘-’ otherwise. • (Reflecting that b is 1 at location j if that location changed in the “current comparison”).
Complexity of the DP approach Number of cells nk. Number of adjacent cells O(2k). Computation of SP score for each column(i,b) is o(k2) Total run time is O(k22knk) which is utterly unacceptable ! Not much hope for a polynomial algorithm because the problem has been shown to be NP complete. Need heuristic to reduce time.
x1 x2 x3 x4 Time saving heuristics: Relevance tests Heuristic: Avoid computing score(i) for irrelevant vectors. Let L be a lower bound on the optimal SP score of a multiple alignment of the k sequences. A lower bound L can be obtained from an arbitrary multiple alignment, computed in any way. Main idea: Using L, compute lower bounds Luv for the optimal score for every two sequences s=xu and t=xv, 1 u < v k. When processing vector i=(..iu,..iv…), the relevant cells are such that in every projection on xu and xv, the optimal pairwise score is above Luv.
t s Recall the Linear Space algorithm • V[i,j] = d(s[1..i],t[1..j]) • B[i,j] = d(s[i+1..n],t[j+1..m]) • F[i,j] + B[i,j] = score of best alignment through (i,j) These computations done in linear space. Build such a table for every two sequences s=xu and t=xv, 1 u, v k. This entry encodes the optimum through (iu,iv).
Time saving heuristics:Relevance test But can we go over all cells determine if they are relevant or not ? No. Start with (0,…,0) and add to the list relevant entries until reaching (n1,…,nk)
Star Alignments Rather then summing up all pairwise alignments, select a fixed sequence x0 as a center, and set Star-score(K) = ∑j>0score(x0,xj). The algorithm to find optimal alignment: at each step, add another sequence aligned with x0, keeping old gaps and possibly adding new ones.
Tree Alignments • Assume that there is a tree T=(V,E) whose leaves are the sequences. • Associate a sequence in each internal node. • Tree-score(K) = ∑(i,j)Escore(xi,xj). • Finding the optimal assignment of sequences to the internal nodes is NP Hard. We will meet again this problem in the next topic: Phylogenetic trees
Multiple Sequence Alignment – Approximation Algorithm In tutorial time you will see an O(k2n2) multiple alignment algorithm that errs by a factor of at most 2(1-1/k) < 2.