Download
1 / 19
190 likes | 305 Views
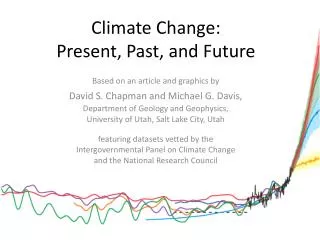
Climate Change in the Geological Past. Keio University. August 2 nd , 2007. Nicholas Herold. The University of Sydney. Supervisors Dietmar M ü ller, John You. Discussion Outline. What, when and why: the Miocene Climatic Optimum (MCO) . The climate model.

E N D
Climate Change in the Geological Past Keio University. August 2nd, 2007 Nicholas Herold The University of Sydney Supervisors Dietmar Müller, John You
Discussion Outline • What, when and why: the Miocene Climatic Optimum (MCO). • The climate model. • Results: sensitivity to model boundary conditions • Vegetation • CO2 • Topography • Conclusions
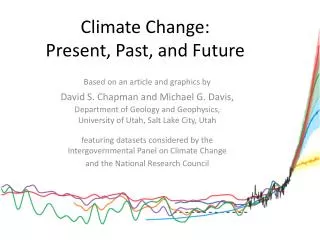
Centennial scale changes in temperature: the Hockey Stick Mann et al. (1998)
The Ice Core Record: Vostok Wuebbles and Hayhoe (2002)
The Geologic Record Zachos et al. (2001)
The NCAR Climate Models • The Community Atmosphere Model (CAM3) and Community Land Model (CLM3). • Coupled to a slab ocean model. • ~3.75° x 3.75° (~416 x 416 km) resolution with 26 atmospheric layers.
Model Resolution George C. Marshall Institute
Model Boundary Conditions • Vegetation: from Wolfe (1985) with amendments to Australia. • Topography: adjustments to the Tibetan Plateau, Andes, Greenland and Antarctica. • 50m sea-level rise. • CO2: low (180 ppmv), medium (355 ppmv) and high (700 ppmv).
June-July-August December-January-February
June-July-August PRECIPITATION SURFACE WINDS CO2_700 – CO2_180 CO2_700 – CO2_180 mm m/s
Conclusions • Realistic vegetation, topography and increased CO2 leads to a 2.7°C warming. • Vegetation and elevation did not affect global temperature significantly. • Leads us to conclude that in addition to CO2 warming was caused by deep ocean circulation, orbital parameters and/or other greenhouse gases (e.g. CH4).
Future Work • Currently attempting to couple a full ocean model to the land and atmosphere models. • Implement orbital values and increased methane concentrations.
Thanks to… • Dietmar Müller and John You • the Australian Research Council (ARC) • the Australian Partnership for Advanced Computing (APAC) National Facility for computer time allocation.
References • Mann, M.E., Bradley, R.S., Hughes, M.K., 1998. Global-scale temperature patterns and climate forcing over the past six centuries. • Wuebbles and Hayhoe, 2002. Atmospheric methane and global change. • Zachos, J., Pagani, M., Sloan, L., Thomas, E., Billups, K., 2001. Trends, Rhythms and Aberrations in Global Climate 65 Ma to Present. • National Center for Atmospheric Research (NCAR). Community Climate System Model - http://www.ccsm.ucar.edu/ • Australian Partnership for Advanced Computing (APAC). http://www.apac.edu.au/ • Wolfe J. A., 1985. Distribution of Major Vegetation Types During the Tertiary.